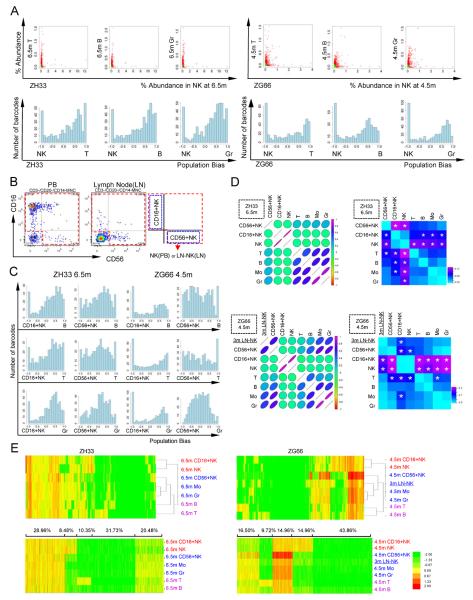
Figure 5. Clonal contributions to NK cells.
(A) Scatter and bias plots for NK versus T, B, and Gr from ZH33(6.5m) and ZG66(4.5m). (B) Example of FACS gating for sorting of NK subsets in blood (ZH33, 6.5m) and node (ZG66, 3m). (C) Bias plots comparing CD16+ and CD56+ NK with B, T, and Gr from ZH33 at 6.5m (left) and ZG66 at 4.5m (right). (D) Graphical summary of Pearson correlation coefficients (left) (Table S7 gives r values, p values and 95% confidence intervals) and fraction of highly biased (>10 fold difference in fractional representation) clones (right) (p values <0.05 are starred), comparing NK cells and subsets from the peripheral blood (ZH33 6.5m, upper panel) and from ZG66 blood (4.5m) and node (3m) (lower panel). Alternative analysis utilizing Spearman correlation shown in Fig S6 and Table S7 (E) Euclidian distance hierarchical clustering (upper panel) and K-mean clustering with k=5 (lower panel), ZH33 (6.5m) and ZG66 (4.5m blood, 3m node). For each animal, all barcodes on the master clone list are included. For K-mean clustering, the % of clones in each cluster is shown above the plots. NK:NK cells in PB; LN-NK: lymph node NK; CD16+NK: CD16+CD56−; 56+NK: CD16−CD56+

