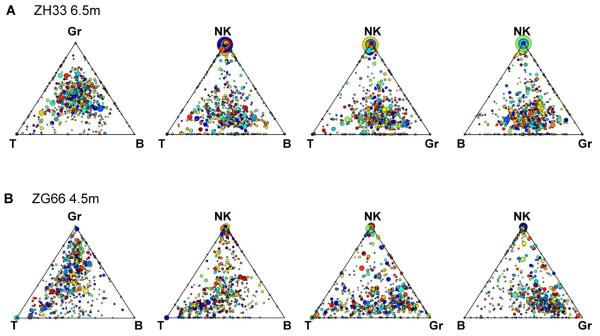
Figure 6. Triangle plots of clonal contributions to T, B, NK and Gr lineages.
Triangle plot of clonal contributions to B, T, NK and Gr in ZH33 at 6.5m (A), or in ZG66 at 4.5m (B). Each dot represents an individual barcoded clone, with the size of the dots corresponding to the total fractional contribution of the individual barcode to the total barcodes retrieved at the time point. The color of the dot is assigned randomly to help distinguish adjacent dots. The location of the barcode represents the ratio of barcode reads in each of the three cell lineages. The presence of large, dots clustering at the vertex of plots including NK cells suggests a unique population of highly biased NK clones in both animals, in contrast to clusters of dots in the center of B/T/Gr triangles, suggesting common clones contributing in a balanced manner to these lineages, particularly by 6.5m in ZH33.

