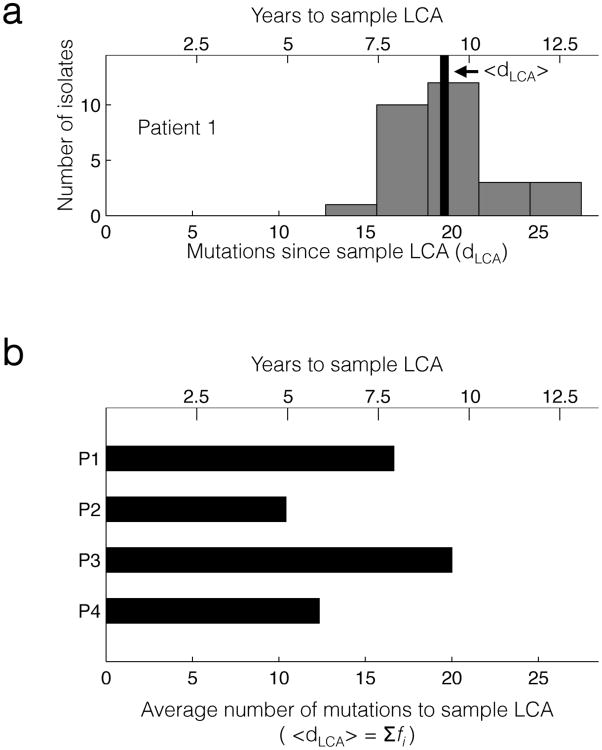
Figure 4. Sublineages coexist within a patient for many years after divergence.
(a) A histogram of the number (dLCA) of single nucleotide mutations found in isolates from Patient 1, relative to their LCA. The black bar indicates the mean value of dLCA across the isolates. (b) The value of <dLCA> from the population sequencing data for patients Patients 1 through 4 (Online Methods). In both panels, the axis at top shows the relationship between dLCA and years to LCA, as calculated via the molecular clock (2.1 SNPs/yr)8.

