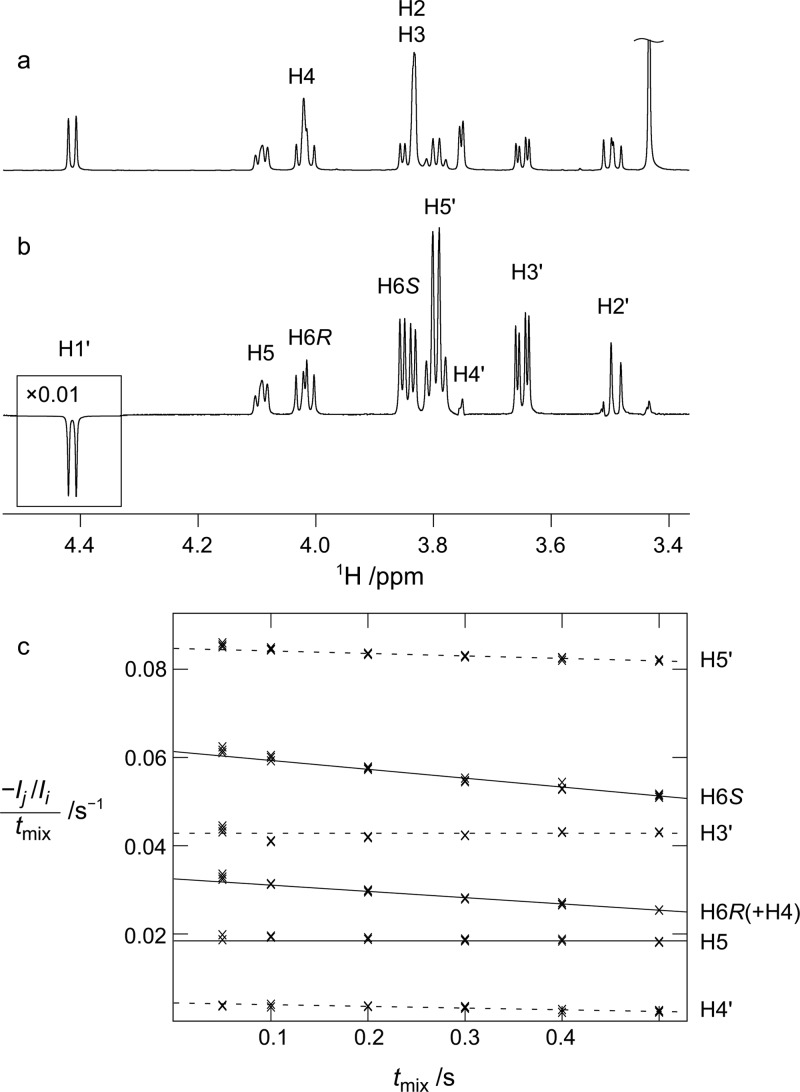
Figure 5.
Cross-relaxation measurements in compound 8: (a) 1D 1H spectrum and (b) 1D 1H,1H SPFGSE NOESY spectrum obtained with excitation at H1′ and a 500 ms cross-relaxation delay (tmix). (c) Normalized peak integrals divided by tmix for different values of tmix (crosses) together with the fitted equations (lines). Intra- and inter-residual interactions are shown as dashed and full lines, respectively.

