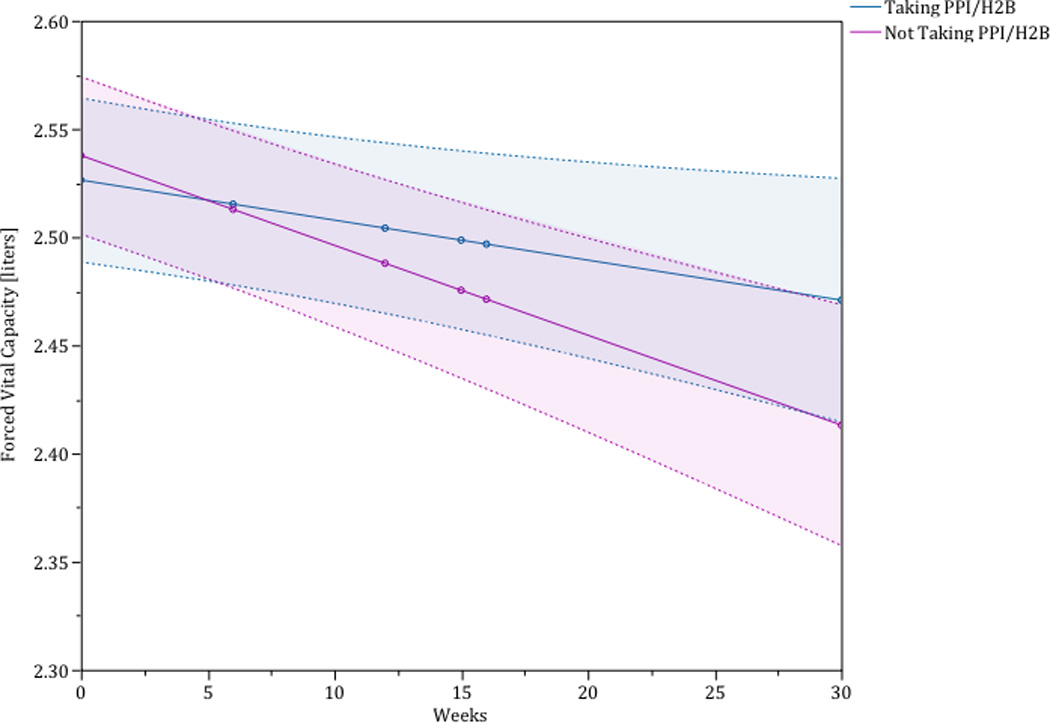
Figure 2.

The blue line depicts the change in forced vital capacity of those patients taking a proton pump inhibitor or histamine-2 blocker. The red line depicts the change in forced vital capacity of those patients not taking a proton pump inhibitor or histamine-2 blocker. The shaded region around each line is the 95% confidence interval. This analysis is adjusted for sex, baseline forced vital capacity %predicted, and baseline diffusing capacity for carbon monoxide %predicted.
