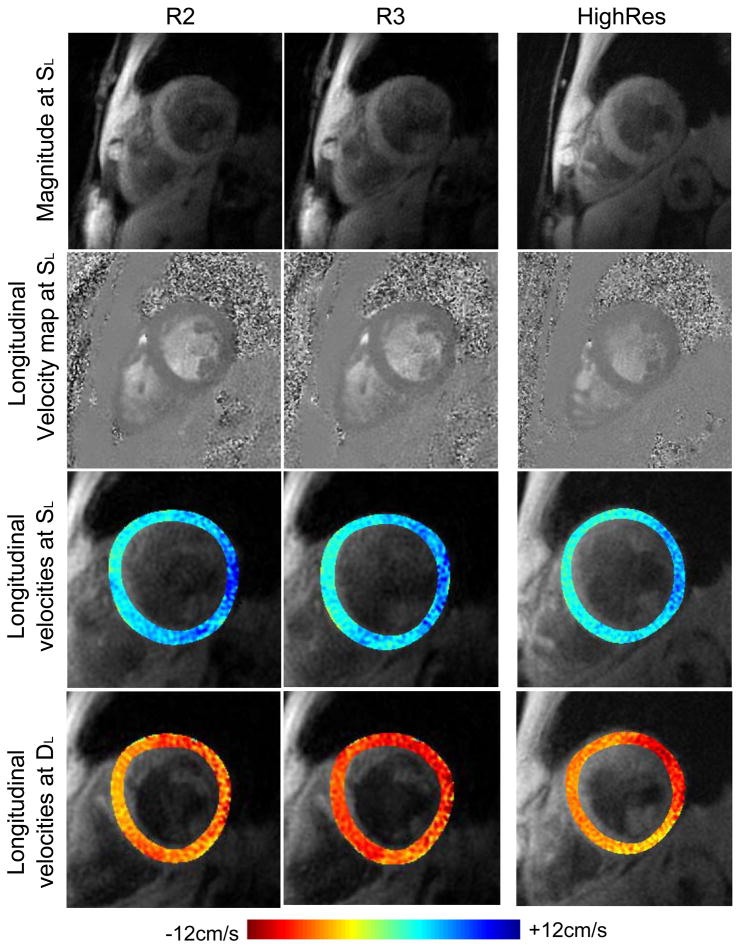
Figure 2.
Top two rows: Example systolic magnitude images (taken at the time of the peak SL) and longitudinal velocity maps for R2 and R3 acquisitions plus HighRes for comparison. Blood suppression is good and off resonance artefacts have been minimised for both. The two acquisitions are of similar quality. Bottom two rows: Longitudinal velocities at the time of SL and DL are shown colour coded and overlaid on the magnitude images. Consistent regional variation is seen between the acquisitions.

