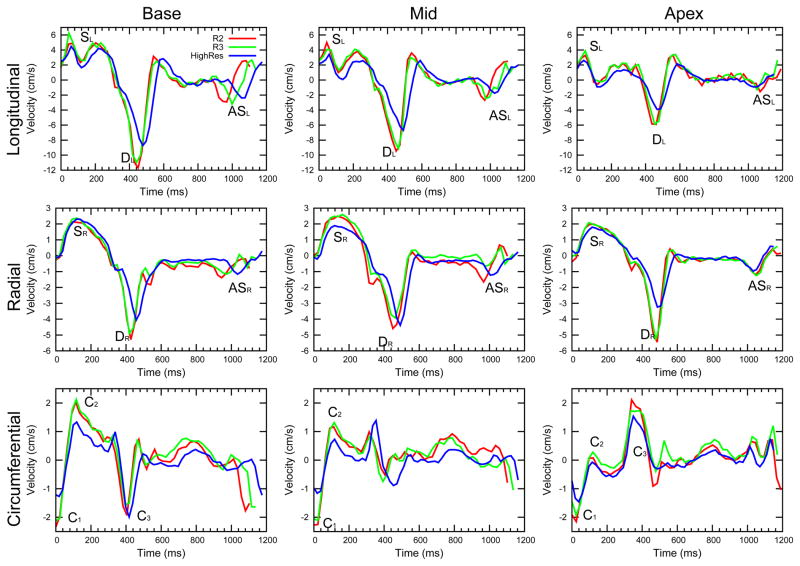
Figure 3.
Example longitudinal, radial and circumferential curves for R2 and R3 acquisitions for a single volunteer. Basal, mid and apical curves are shown, and in all plots the main peaks are labelled. The velocity-time curves from the two accelerated acquisitions show highly similar features. Also shown are the same plots from the previously acquired HighRes acquisitions in the same volunteer for comparison.

