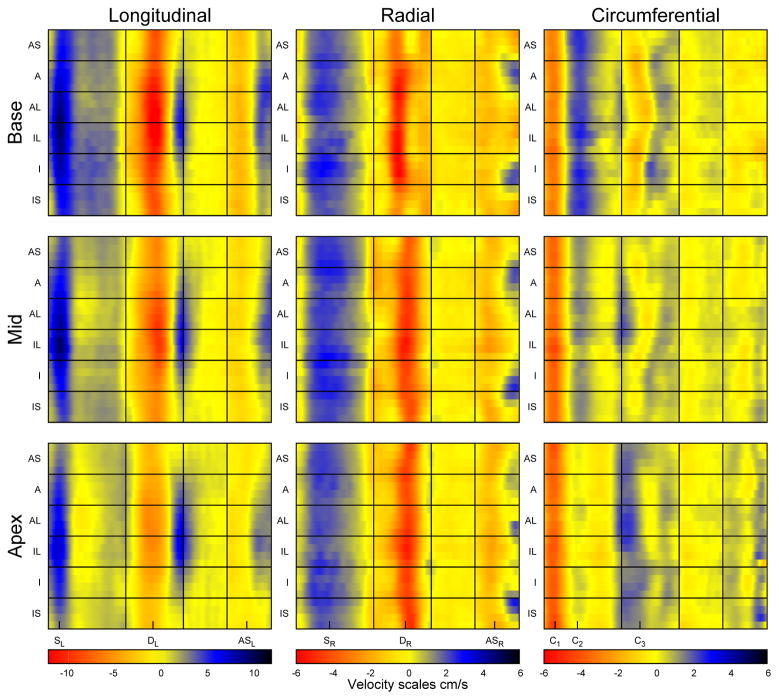
Figure 5.
Colour plots showing regional variation of myocardial velocities averaged over the R3 acquisitions in all volunteers. Note the different scales for each direction of velocity. The main peaks used for characterising global velocities are indicated below the plots. (AS = anteroseptum, A = anterior, AL = anterolateral, IL = inferolateral, I = inferior, IS = inferoseptal).

