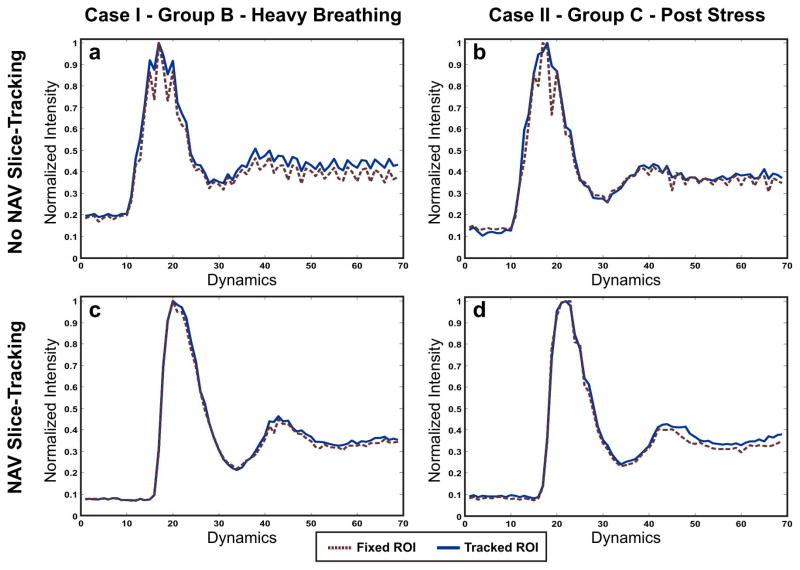
Figure 9.
Normalized signal intensity curves from two cases: one case from Group B (first column; graph a and c) and one case from Group C (second column; graphs b and d). In each case, the upper row shows the curve calculated from the non NAV-tracking perfusion sequence, and the lower row shows the curve calculated from the NAV-tracking perfusion sequence. In each graph, the perfusion curve is calculated using two methods: fixed-ROI (in red dotted lines), and manually tracked-ROI (in solid blue lines). Note that in general, the manually tracked ROIs result in smoother curves. However, when using the NAV slice tracking, the curves becomes smoother for both fixed and manually tracked ROIs.

