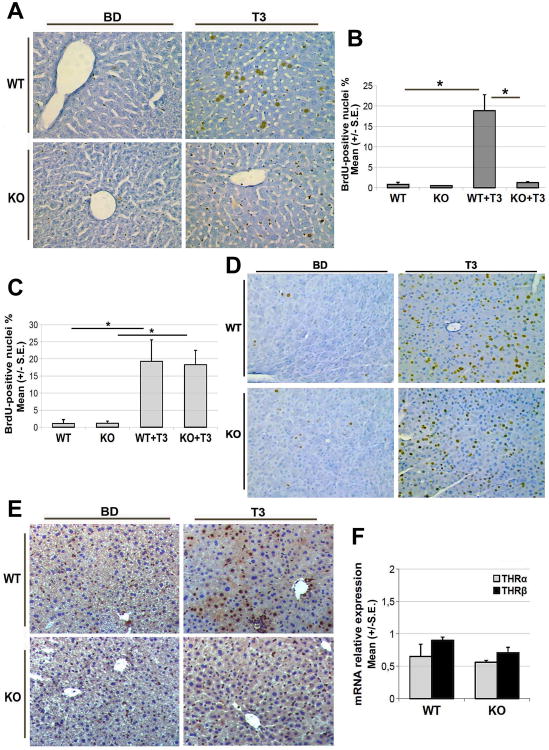
Figure 2. Lack of β-catenin in hepatocytes impairs hepatocyte proliferation and Cyclin-D1 expression in response to T3 diet.
A. Representative microphotographs showing immunohistochemical staining for BrdU in the WT and KO livers after T3-treatment for 4 days (200×). Several BrdU-positive hepatocyte nuclei are observed in livers of WT mice fed T3 for 4 days. KO after T3 treatment lack BrdU staining in the hepatocytes although BrdU-positive non-parenchymal cells are evident, similar to WT livers. At least three WT and KO were used throughout this study.
B. A significant (*p<0.05) decrease in BrdU LI of hepatocytes in KO versus WT mice after T3 treatment. While T3 stimulated BrdU incorporation in the WT hepatocytes, no significant increase was evident in KO hepatocytes. At least 5000 hepatocyte nuclei per liver were scored. The LI is expressed as number of BrdU-positive hepatocyte nuclei/100 nuclei. Results are expressed as mean ± standard error (S.E.) of 3 or more mice per group.
C. LI of pancreatic acinar cells in WT and KO mice shows no significant difference between the two groups following treatment with T3-supplemented diet (4 mg/kg) for 7 days. T3 stimulated BrdU incorporation in pancreatic acinar cells comparably and significantly (*p<0.05) in WT and KO. At least 2000 acinar cell nuclei per pancreas were scored. LI was expressed as number of BrdU-positive acinar cell nuclei/100 nuclei and results expressed as mean ± standard error (S.E.) of 3 or more mice per group.
D. Representative photomicrographs showing labeling of BrdU in the pancreas of WT and KO mice treated with T3 for 4 days (200×).
E. Representative microphotograph of Cyclin-D1 staining in the WT and KO livers after 4 days of T3-feeding (200×). Absence of Cyclin-D1 immunoreactivity in KO hepatocytes nuclei is clearly evident despite T3 feeding as compared to the WT.
F. qRT-PCR analysis of TRα and TRβ expression in livers of untreated WT and KO mice. 18S was used as endogenous control. Error bars represent the standard error (S.E) of TaqMan RT-PCR performed in triplicates.

