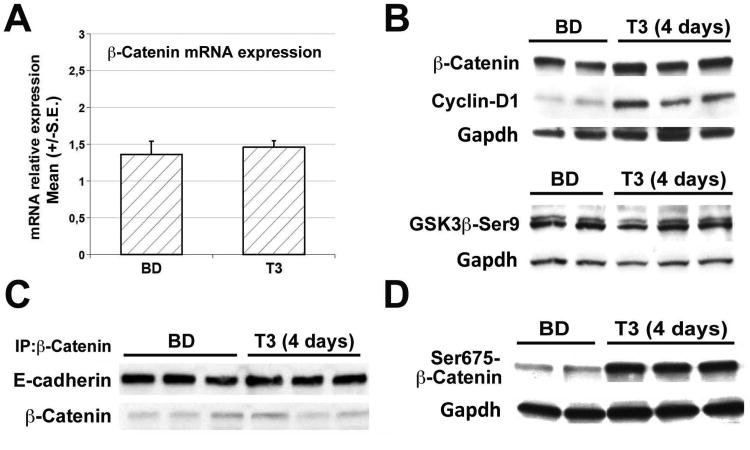
Figure 4. T3 induced β-catenin activation via Ser675-phosphorylation.
A. qRT-PCR analysis of β-catenin expression (normalized to cyclophilin A) in C57BL6 mice treated with T3 for 4 days shows no change. Error bars represent the standard error (S.E.) of TaqMan RT-PCR performed in triplicates.
B. Representative western blots show T3 feeding for 4 days does not lead to a notable increase in total β-catenin when compared to basal diet fed mice. However Cyclin-D1 levels are consistently increased. GSK3β-Ser9 levels remain unaffected at 4 days of T3 treatment. Gapdh verifies equal loading. Each lane represents an individual sample.
C. Immunoprecipitation studies from three representative livers show no change in association of β-catenin and E-cadherin in the livers of 4 days T3- versus basal diet-fed C57BL/6 mice.
D. Representative western blot shows a noteworthy increase in pSer675-β-catenin levels in 4 days T3-fed as compared to control diet-fed C57BL/6 mice. Gapdh verified equal loading.

