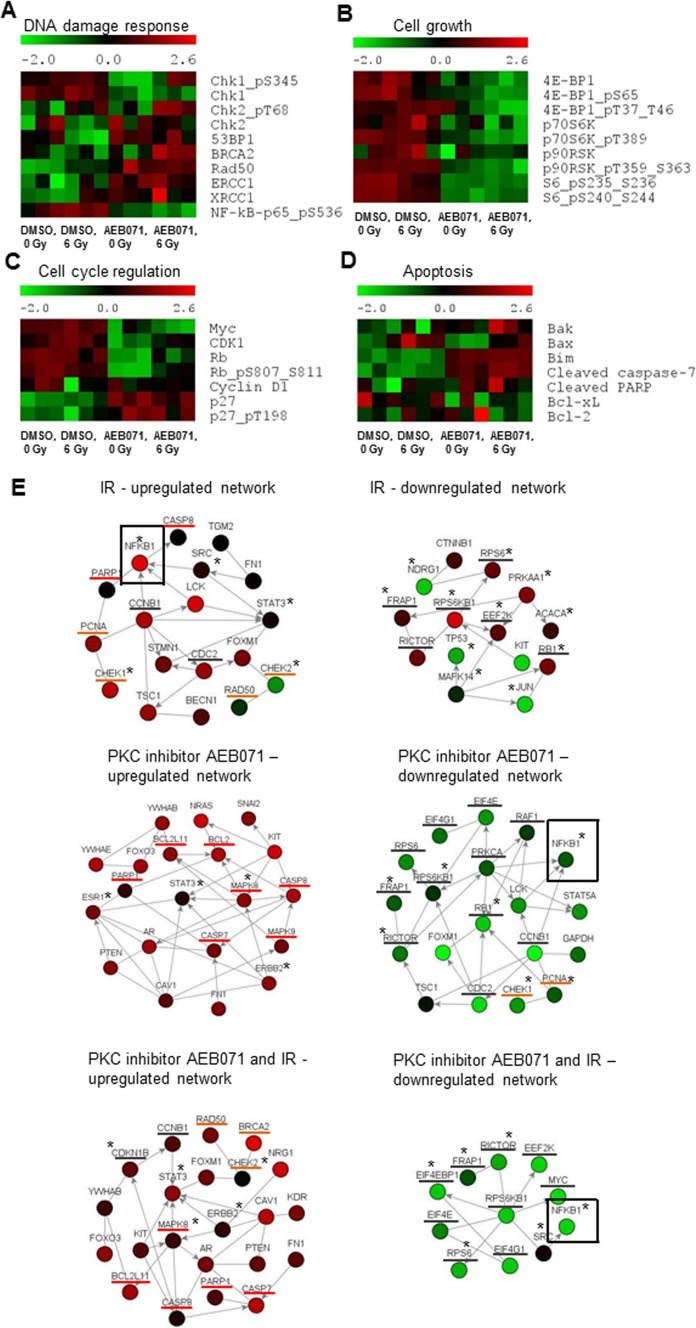
Figure 5.
PKC inhibitor AEB071 modulates IR-induced changes in protein expression and posttranslational modification in GNAQmt UM cells. GNAQmt Mel202 cells were treated with DMSO or AEB071 (0.5 μM) for 3 hours followed by 0 or 6 Gy of IR. Cell lysates were collected 18 hours after IR, and the expressions of proteins were determined by RPPA. Heat maps represent normalized expression values for each protein (red, high; green, low). Each treatment was done in triplicate, which corresponds to three distinct heat map boxes per treatment condition. Effects on the expression of select proteins controlling (A) DNA damage response, (B) cell growth, (C) cell-cycle regulation, and (D) apoptosis are presented. (E) Network analysis was performed to identify the most represented signaling networks on each treatment condition using NetWalker software. The top 30 most up- and downregulated protein-protein interactions based on EF values were used to generate network diagrams. Color scale corresponds to the z-score transformed normalized expression values for each protein presented in the network. Nodes, proteins; edges, network interactions between proteins; asterisks, phosphorylated proteins; underlined in red, proteins involved in apoptosis; underlined in orange, proteins involved in the DNA damage response; underlined in grey, proteins involved in cell-cycle progression and cell growth.

