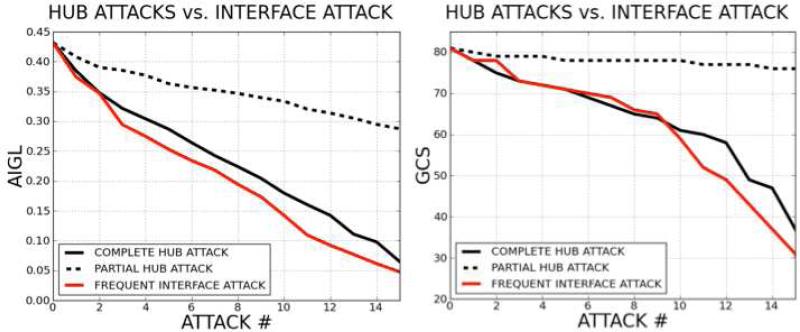
Figure 12. Hub Node Attack versus Most Frequent Interface Attack.
The figure plots of the damage to the network following 15 successive complete hub node attacks, partial hub node attacks and frequent interface attacks (for AIGL (on the left) and GCS (on the right) topological parameters). The results suggest that the most frequent interface attack and complete hub knockout lead to roughly the same damage, while the effect of the partial hub knockout is to a lesser extent.

