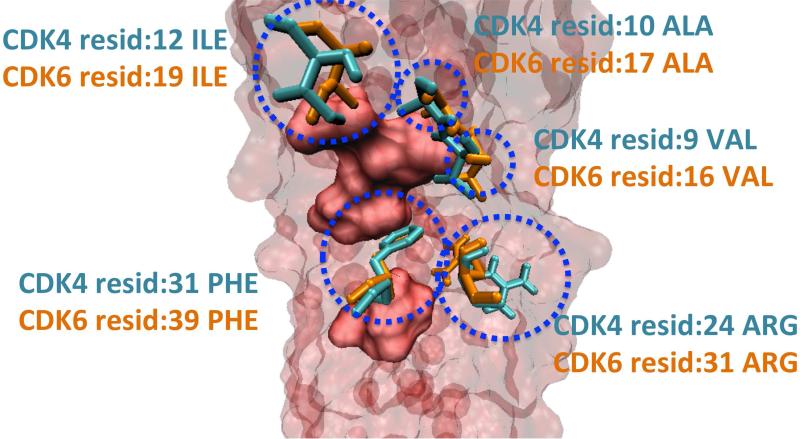
Figure 7. Hotspots of CDK4-CDKN2D and CDK6-CDKN2D Interfaces.
The predicted hotspots of CDK4 (cyan) and CDK6 (orange) proteins are represented with “Licorice” and the hotspots of CDKN2D are drawn as a (red) surface, using VMD 90. The red, transparent body in the background is also CDKN2D protein. CDK4 and CDK6 have a number of identical hotspots, when their interfaces with CDKN2D are superimposed.

