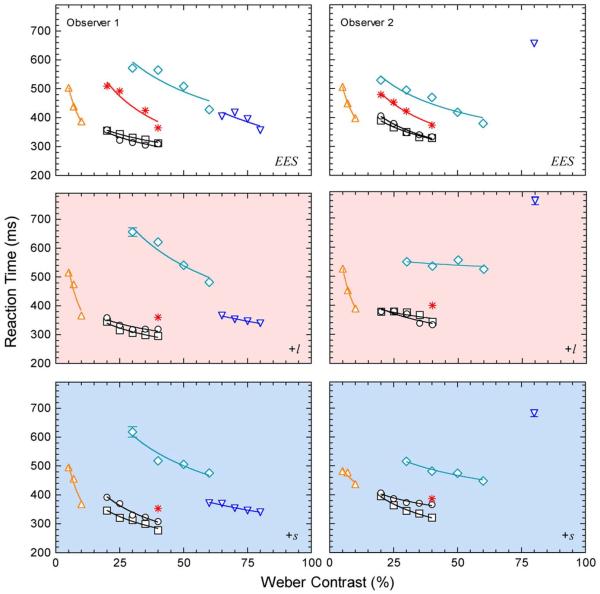
Fig. 2.
RT data for mesopic rod and cone signaling mediated via the inferred MC, PC, and KC pathways. All data were measured in condition A shown in Fig. 1. The left and right columns show the mean RT data (±SEM) for two observers measured on the equiluminant center and surround fields that were metameric to an (EES (upper row), had higher L/(L + M) (middle row) or higher S-cone excitation (lower row). The symbols specify the six photoreceptor excitation conditions: circles (L + M + S: variable cone luminance with a constant rod excitation and cone chromaticity); squares (L + M + S + R: variable rod and cone-mediated luminance with in phase modulation of rod and cone excitations and a constant cone chromaticity); asterisks (L-cone: variable L-cone excitation, therefore both cone chromaticity and luminance were changing, constant M, S, rod excitation); upward triangles (+L-M: variable l = L/(L + M), constant S, rod excitation, and constant cone luminance); downward triangles (S-cone: variable S-cone excitation, constant L, M, rod excitation, and constant cone luminance); diamonds (rod: variable rod excitation, constant L, M, S excitation therefore constant cone chromaticity and cone luminance). The solid lines show the best-fitting Piéron functions.

