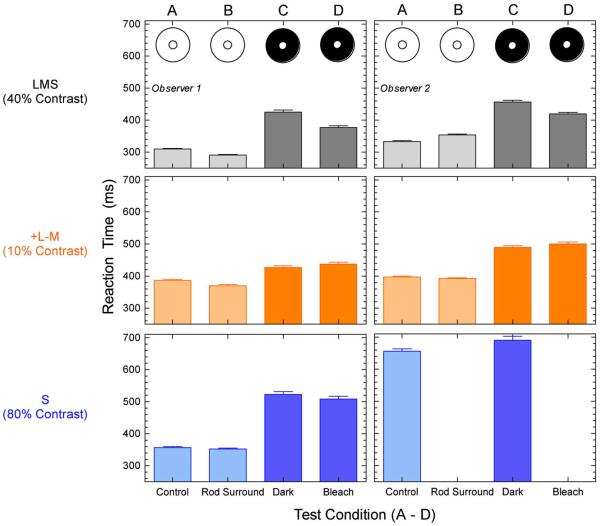
Fig. 3.
Effect of rod–cone interactions on cone-mediated luminance and chromatic RT. The left and right columns show the mean RT data (+SEM) for the two observers at the maximum stimulus contrast measured for the L + M + S stimulus (upper row), the +L-M stimulus (middle row) and the S-cone stimulus (lower row). Data are for the EES adapting chromaticity. The labels and schematics A through D identify the four experimental conditions defined in Fig. 1.

