Fig. 3.
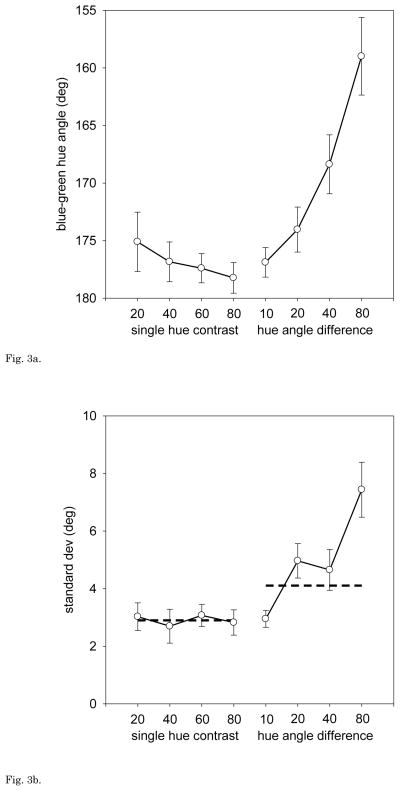
Fig. 3a. Yoked Hue Pairs: Mean blue-green settings for 13 observers as a function of the contrast of a uniform-hue array (leftmost points) or the hue-angle difference of pairs with a fixed contrast of 80 (rightmost points). Error bars = ±1 SEM.
Fig. 3b. Yoked Hue Pairs: Average standard deviation of the individual’s settings for the same stimuli, based on 4 repeated settings per condition. Error bars = ±1 SEM. Dashed lines – predicted difference in the standard deviation of the settings for the uniform vs. 2-component arrays if the errors in judging the two components are independent and additive.

