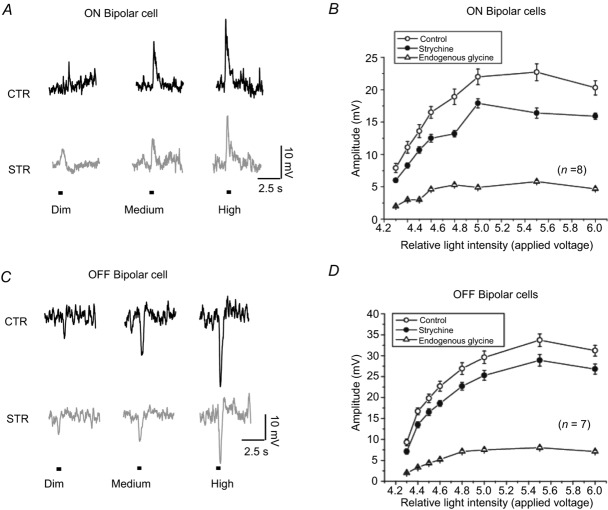
Figure 7.
A and C, intracellular recording of light-evoked responses from ON and OFF bipolar cells. The cells were stimulated by a range of intensities (between 0.6 and 2.4 lux) that generated a graded series of responses. Strychnine reduced the light response of bipolar cells. B and D, intensity–response curves generated from ON and OFF bipolar cells (n = 5) in control and strychnine. Subtraction of the two curves (triangles) reveals the enhancement of light-evoked responses by endogenous glycine. CTR, control; STR, strychnine.

