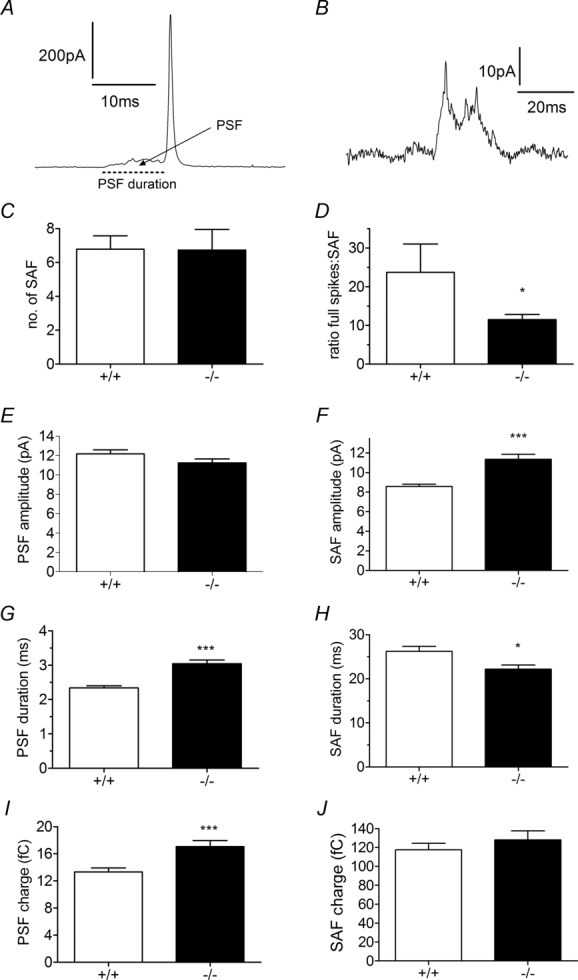
Figure 4.

A, a full fusion event preceded by a pre-spike foot (PSF) signal (arrow, dotted line indicates PSF duration) representing catecholamine release during fusion pore formation and stabilization. B, when a fusion pore does not stabilize into a full fusion pore but instead reverses and closes, only a stand-alone foot (SAF) signal is observed. C, D, there is no change in the average number of SAF events (C), and SAF events are more frequent in relation to full fusion events in HAP1−/− cells (D). E, F, in HAP1−/− cells, PSF amplitude is unchanged (E), but SAF amplitude is increased (F). G, H, PSF duration is longer in HAP1−/− cells (G), but SAF duration is shorter (H). I, J, in HAP1−/− cells, PSF area is larger (I), but SAF charge is unchanged (J). (*P < 0.05, ***P < 0.001; n = 523 PSF and n = 186 SAF in HAP1+/+ cells; n = 326 PSF and n = 192 SAF in HAP1−/− cells.)
