Figure 5.

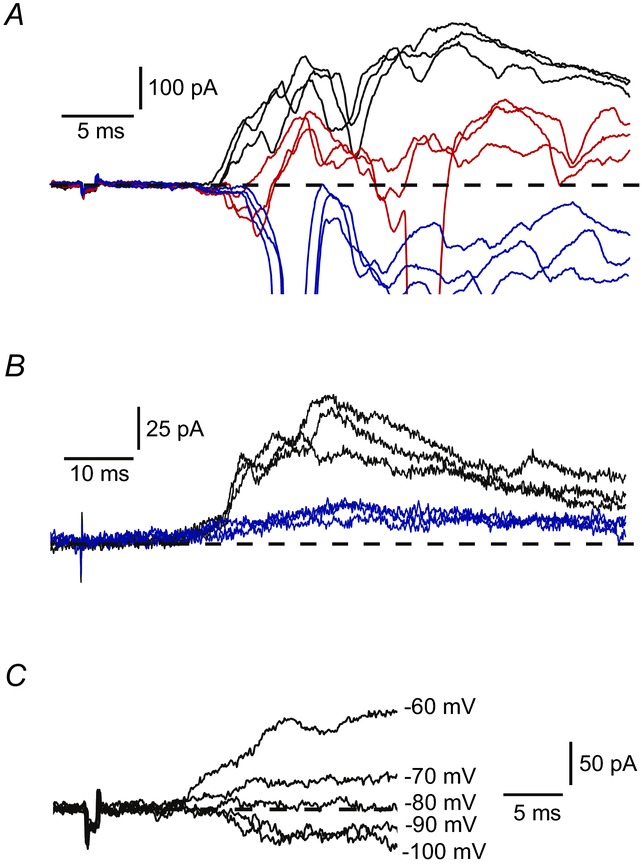
A, IPSCs in control (black), in 100 μm picrotoxin (red) and after addition of 1 μm strychnine (blue). Potential: −70 mV. B, IPSCs in control (black) and in 1 μm strychnine (blue). C, an IPSC at different membrane potentials.

A, IPSCs in control (black), in 100 μm picrotoxin (red) and after addition of 1 μm strychnine (blue). Potential: −70 mV. B, IPSCs in control (black) and in 1 μm strychnine (blue). C, an IPSC at different membrane potentials.