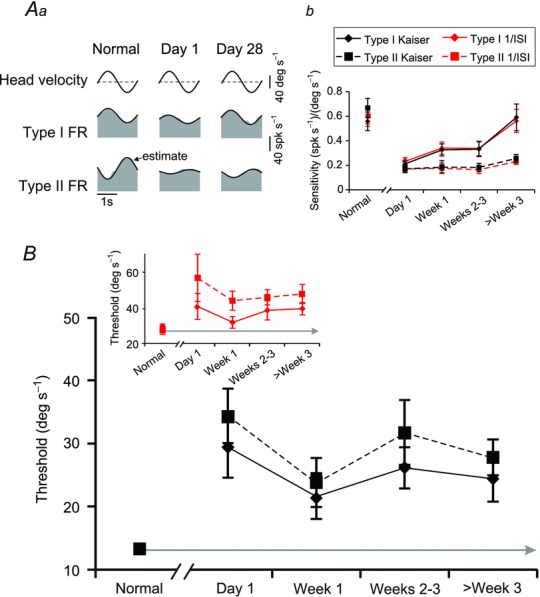
Figure 2.

A, example of type I and type II VO responses (Aa) before, immediately following, and 4 weeks after contralateral labyrinthectomy and population summary (Ab) of the changes in vestibular sensitivity of type I (solid) and type II (dashed) VO neurons. Comparable sensitivities were also measured when firing rates were estimated either using the Kaiser filter (black lines) or inverse interspike interval method (red lines). Note that the grey area in (Aa) represents the actual firing rate while the overlaying black trace illustrates the ‘estimated’ firing rate obtained using eqn (1). B, summary of the vestibular detection thresholds of type I (solid) and type II (dashed) VO neurons before and throughout the time course of recovery following unilateral labyrinthectomy using either a Kaiser filter (black lines) or the inverse interspike interval (inset: red lines) to estimate firing rate. FR, firing rate; VO, vestibular-only. Error bars indicate s.e.m.
