
Figure 3.
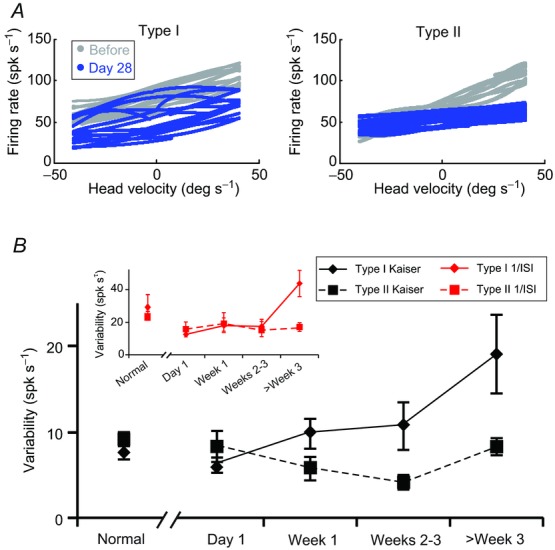
A, example of firing rate versus head velocity curves for control type I and type II vestibular-only (VO) neurons (grey) and typical type I and type II VO neurons recorded 4 weeks after the lesion (blue). B, summary of the changes in neuronal firing rate variabilities of type I (solid) and type II (dashed) VO neurons from normal and several time points after lesion using either a Kaiser filter (black lines) or the inverse interspike interval (inset: red lines) to estimate the firing rate. Type I neurons (n = 18, 26, 12, 18, 17 for normal, day 1, week 1, weeks 2–3 and week 3 and after) in diamonds, and type II neurons (n = 26, 8, 18, 8, 28 for normal, day 1, week 1, weeks 2–3 and week 3 and after) in squares. Error bars indicate s.e.m.