
Figure 6.
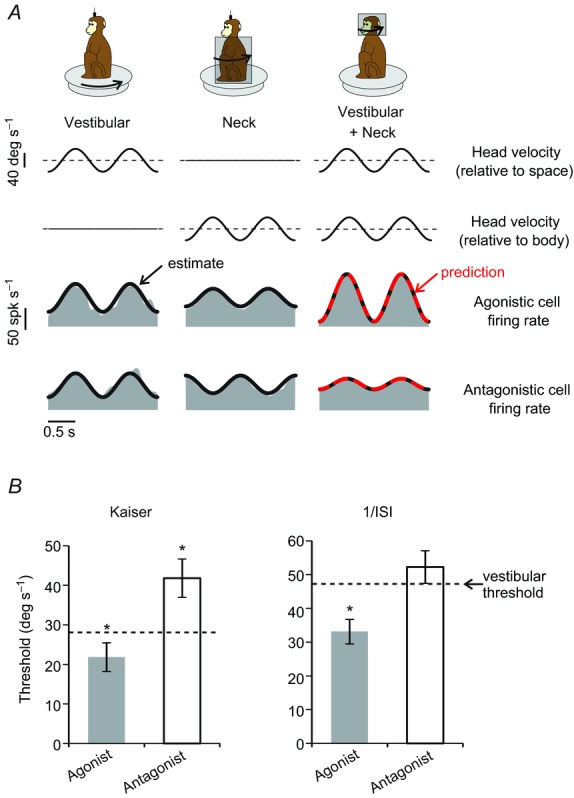
A, activity of two example vestibular-only neurons (two bottom rows: agonistic and antagonistic neurons, respectively) during 1 Hz sinusoidal passive head-on-body rotations. The two example neurons showed similar sensitivities to vestibular stimulation (left column: whole-body rotation) as well as comparable but opposite sign sensitivities to neck stimulation (middle column: body-under-head rotation). Accordingly, linear summation of these two sensitivity components resulted in a greater overall sensitivity for the agonistic neuron compared to the antagonistic neuron during ‘vestibular + neck’ stimulation (right column: head-on-body rotation). Linear summation of response sensitivities during individual stimulation of vestibular and neck sensors provided a prediction (red dashed line) comparable to the best fit estimation during the head-on-body rotations (thick black line). B, population-averaged neuronal thresholds for agonistic and antagonistic neurons following labyrinthectomy. Agonist neurons display a lower threshold for head-on-body motion (grey bar) as compared to whole body rotation (vestibular stimulation: dashed line), the converse is true for antagonist neurons (compare white bar with dashed line). Similar results were obtained when either Kaiser filter (left) or inverse interspike interval (right) methods were used to estimate firing rate. Error bars indicate s.e.m. *P < 0.05.