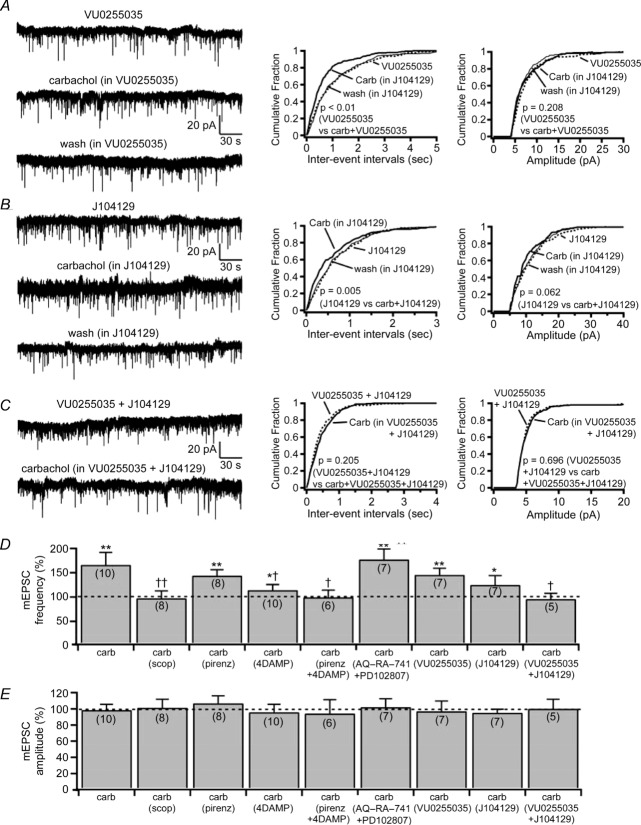
Figure 7.
A and B, the M1-selective and the M3-selective muscarinic receptor antagonists, VU0255035 (1 μm) and J104129 (50 nm), produce only a partial block of the effects of carbachol on the mEPSC frequency. C, co-application VU0255035 (1 μm) + J104129 (50 nm) abolishes the effects of carbachol. The effects of carbachol on the mEPSCs in the presence of VU0255035, J104129 and VU0255035 + J104129 are shown in three representative SLDsp neurons. The current traces are represented in the left panels and the cumulative distribution plots of mEPSC interevent interval and amplitude are represented in the centre and right panels, respectively. D and E, summary bar graphs compare the effects on mEPSC frequency (D) and mEPSC amplitude (E) of carbachol applied alone (n = 10) and in the presence of scopolamine (10 μm, n = 8), pirenzepine (10 μm, n = 8), 4-DAMP (100 nm, n = 10), 4-DAMP + pirezepine (n = 6), AQ-RA-741 (200 nm) + PD102807 (1 μm, n = 7), VU0255035 (1 μm, n = 7), J104129 (50 nm, n = 7), and VU0255035 + J104129 (n = 5). *P < 0.05 and **P < 0.01, Student's paired t test comparing the effects on mEPSC frequency and mEPSC amplitude before and during carbachol applications (carb vs. con; scop + carb vs. scop; pirenz + carb vs. pirenz; 4-DAMP + carb vs. 4-DAMP; pirenz + 4-DAMP + carb vs. pirenz + 4-DAMP; AQ-RA-741 + PD102807 + carb vs. AQ-RA-741 + PD102807; VU0255035 + carb vs. VU0255035; J104129 + carb vs. J104129; and VU0255035 + J104129 + carb vs. VU0255035 + J104129). Effects of carbachol on mEPSC frequency (F(8,59) = 2.635, P = 0.015, one-way ANOVA) and mEPSC amplitude (F(8,59) = 0.153, P = 0.996, one-way ANOVA), †P < 0.05 and ††P < 0.01, Fisher's PLSD comparing the effects of carbachol in control ACSF and in the presence of muscarinic receptor antagonists (carb vs. carb in scop; carb vs. carb in pirenz; carb vs. carb in 4-DAMP; carb vs. carb in pirenz + 4-DAMP; carb vs. carb in AQ-RA-741 + PD102807; carb vs. carb in VU0255035; carb vs. carb in J104129; and carb vs. carb + VU0255035 + J104129). Miniature EPSCs were recorded in TTX (1 μm) at Vh = −60 mV. In the cumulative distributions, results are represented before carbachol application as dotted lines, during carbachol application as bold lines and after carbachol application as thinner lines, and P values refer to Kolmogorov–Smirnov tests.

