
Figure 5.
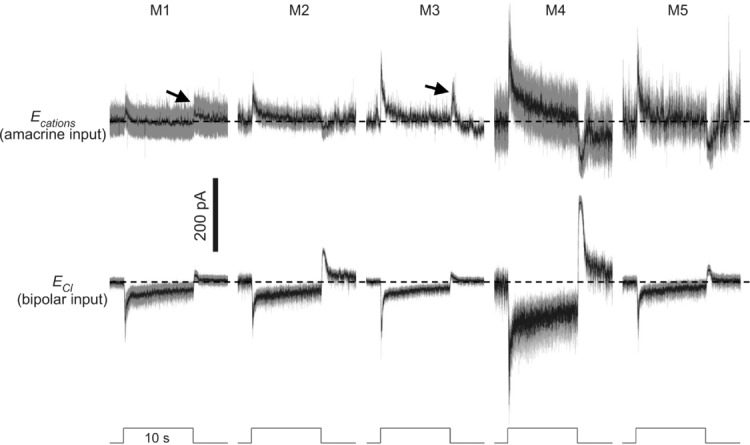
All light stimuli were 8.5 log quanta cm−2 s−1, below the threshold intensity for inducing melanopsin responses. In the top traces, to analyse amacrine-driven light responses in isolation, ipRGCs were voltage clamped at the reversal potential for cationic input (Ecations). The arrows highlight light-off conductance increases detected in M1 and M3 cells, the only ipRGC types that possess dendrites in the ‘off’ sublamina of the inner plexiform layer. For M1, n = 5; M2, n = 12; M3, n = 9; M4, n = 9; and M5, n = 4. In the bottom traces, to record bipolar-driven light responses, ipRGCs were voltage clamped at the reversal potential for chloride (ECl). For M1, n = 10; M2, n = 10; M3, n = 13; M4, n = 8; and M5, n = 4. The horizontal dashed lines indicate prestimulus baselines.