
Figure 1.
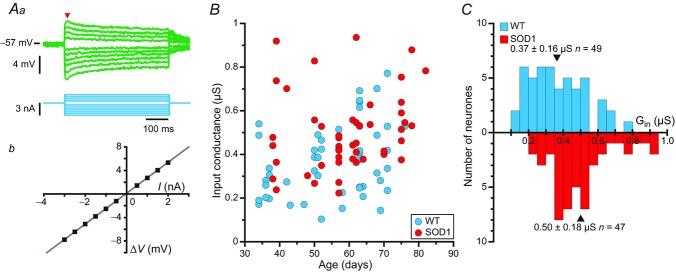
Aa, average responses of a mSOD1 motoneurone (top traces; each trace is an average of five sweeps) to a series of current pulses (bottom traces) lasting 500 ms and ranging from −3 to +2 nA. Notice the sag on the voltage response of the motoneurone: the voltage rapidly reached a peak, before stabilizing to a lower plateau value. Ab, plot of the deflection of the voltage (ΔV, measured at the peak of the response, arrowhead in Aa) versus the intensity of the current pulse. B, plot of the input conductances of WT and mSOD1 motoneurones versus the age of the mice. C, distribution of the input conductances (Gin) of WT (top) and mSOD1 (bottom) motoneurones. In each histogram, arrowheads mark the position of the mean. mSOD1, mutant superoxide dismutase 1; WT, wild-type.