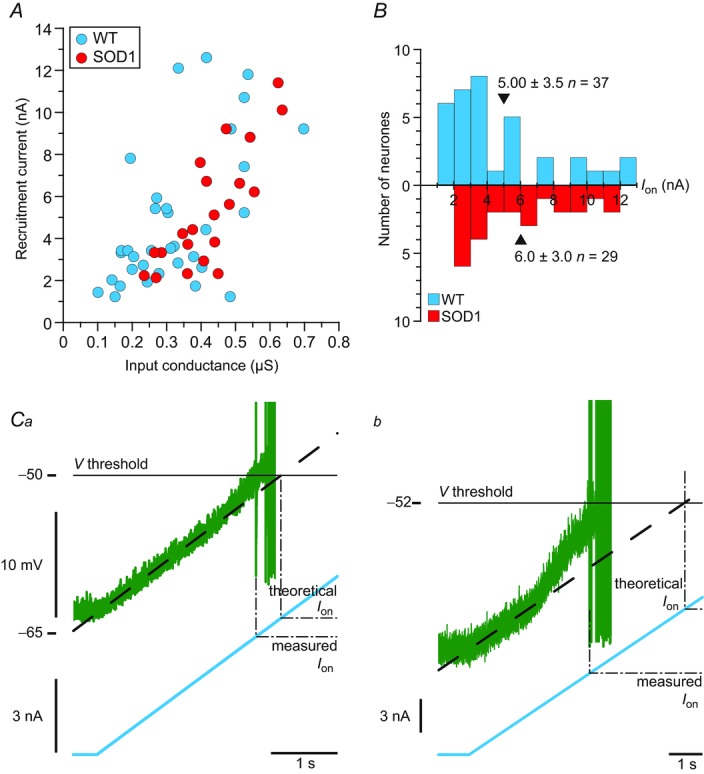
Figure 3.

A, plot of the recruitment current of WT and mSOD1 motoneurones versus input conductance. B, distributions of recruitment current of WT and mSOD1 motoneurones. The mean values are indicated by arrowheads. C, magnification of the voltage (top trace) and current (bottom trace) near the recruitment of a WT (Ca) and mSOD1 (Cb) motoneurone (the mSOD1 motoneurone is the one illustrated in Fig. 2A). Ion is measured as the current intensity at which the motoneurone fires the first spike (‘measured Ion’, dashed line), while the ‘theoretical Ion’ is the current intensity that would be needed to reach the same voltage threshold if the membrane was purely passive (dot-dashed line). mSOD1, mutant superoxide dismutase 1; WT, wild-type.
