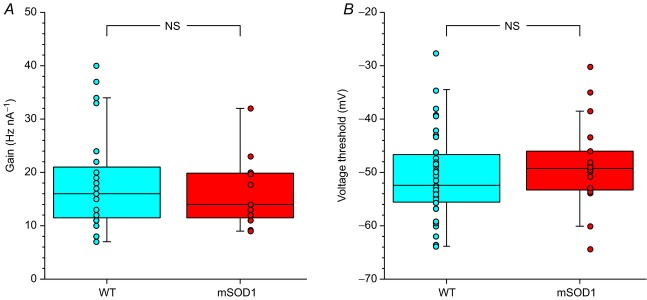
Figure 4.

A, box-and-whisker diagram and data points of the distribution of the gain (measured in the primary range) of WT and mSOD1 motoneurones. B, box-and-whisker diagram and data points of the distribution of the voltage threshold of WT and mSOD1 motoneurones. In both diagrams, the central box represents the values from the lower to upper quartile (25–75th percentile). The middle line represents the median. The vertical line extends to the minimum and maximum values that fall within 1.5 times the interquartile distance. mSOD1, mutant superoxide dismutase 1; NS, not significant; WT, wild-type.
