
Figure 8. Relationship between relative geographical inequality for use of improved drinking water and RGI for use of improved sanitation for.
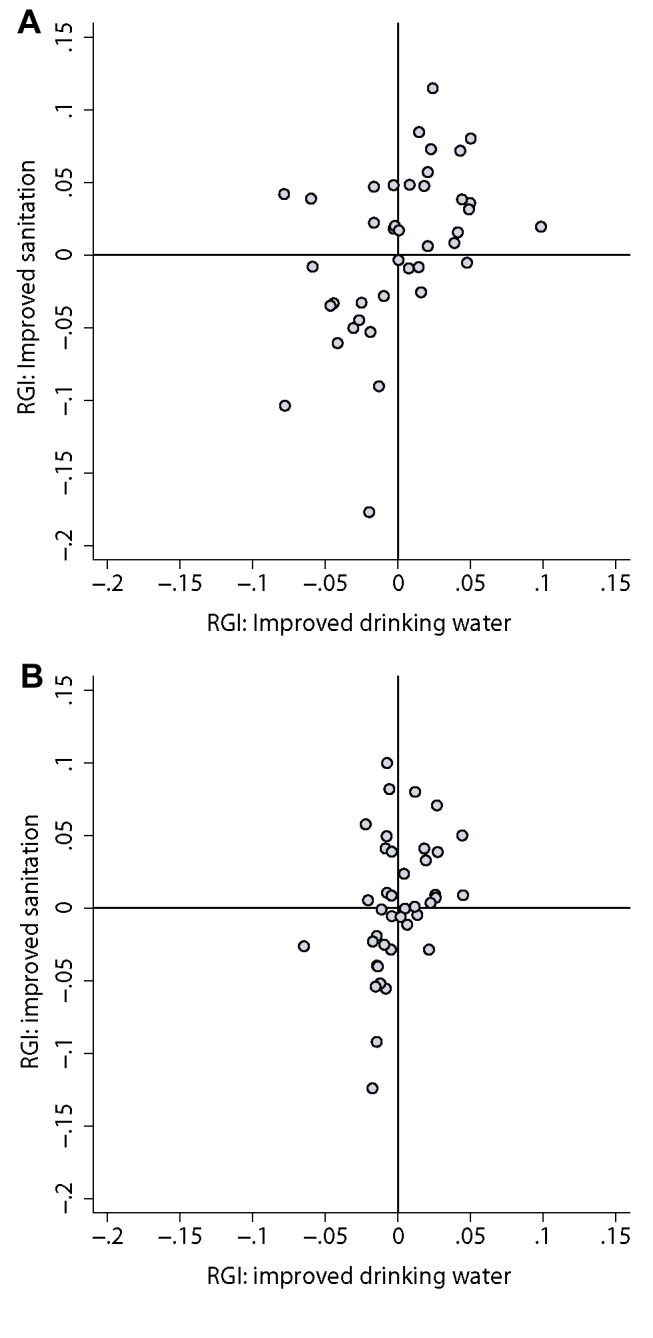
(A) rural populations (correlation (r) = 0.47, p = 0.002) and (B) urban populations (r = 0.39, p = 0.01).
Official websites use .gov
A
.gov website belongs to an official
government organization in the United States.
Secure .gov websites use HTTPS
A lock (
) or https:// means you've safely
connected to the .gov website. Share sensitive
information only on official, secure websites.
(A) rural populations (correlation (r) = 0.47, p = 0.002) and (B) urban populations (r = 0.39, p = 0.01).