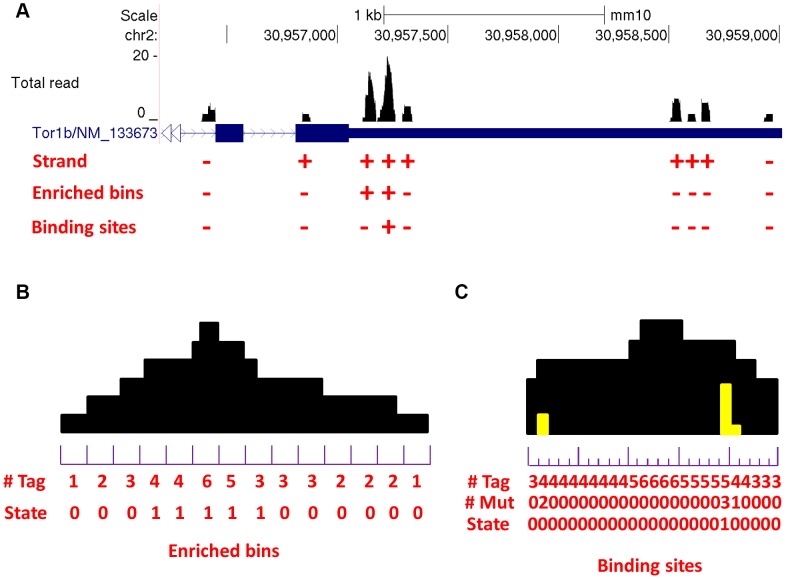
Figure 1. Demonstration of the MiClip algorithm.
(a) The inference results of MiClip on AGO CLIP clusters. At the bottom, “Strand” refers to the strands of clusters, “Enriched bins” shows whether a cluster contains enriched bins and “Binding sites” shows whether a cluster contains binding sites. This region covers part of the Tor1b gene. (b) A cartoon of the first HMM. At the bottom, “# Tag” refers to the rounded number of tags covering each bin and “State” shows whether a bin was inferred to be “enriched”. (c) A cartoon of the second HMM. At the bottom, “# Tag” refers to the number of total tags covering each base, “# Mut” refers to the number of mutant tags covering each base and “State” shows whether a base was inferred to be a “binding site”.

