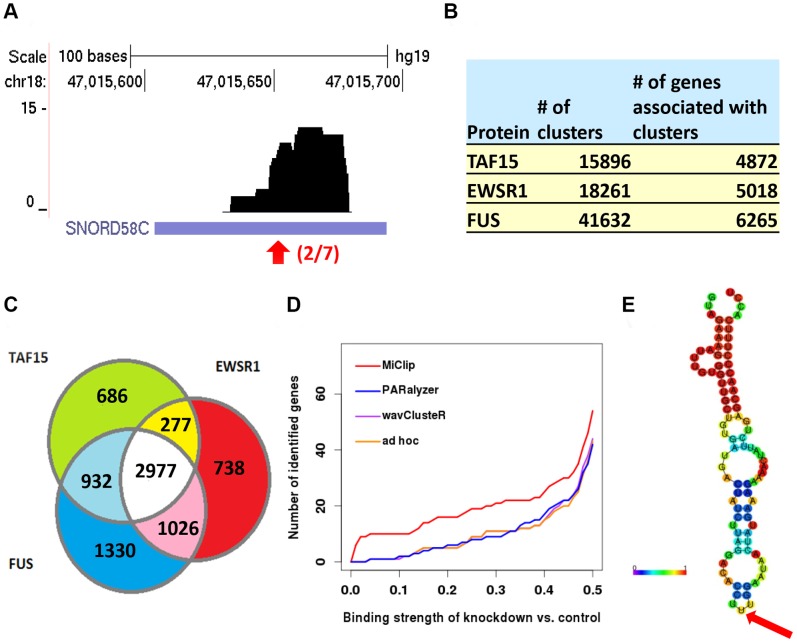
Figure 4. Results produced by MiClip on the FET family PAR-CLIP dataset.
(a) Genome Browser visualization of an exemplary FUS cluster. Red arrow denotes the binding site. 2 out of 7 tags on this base have T->C mutations. (b) The number of reliable CLIP clusters identified in each sample and the number of genes whose gene bodies contain at least one cluster. (c) A Venn diagram of the overlap between gene targets identified by MiClip for TAF15, EWSR1 and FUS. (d) Number of target genes identified by MiClip, PARalzyer, wavClusteR and the ad hoc method in the FUS experiment. The x-axis is the cutoff ratio of the amount of RNA sequenced in the knockdown vs. control condition from the Han, et al. experiment. To be fair, genes are sorted first by the number of overlapping significant CLIP clusters, and ties are then sorted by the number of bases in each gene that have non-zero coverage of CLIP clusters. The top 5000 genes found by each tool were used for comparison. (e) The secondary structure of SNORD58C predicted by the RNAfold online server. The color bar shows the base-pair probabilities. The red arrow points to the identified binding site by MiClip.

