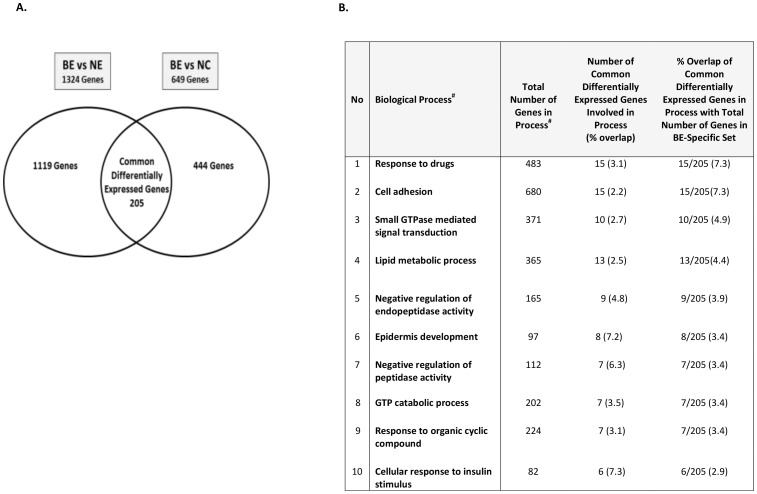
Figure 2. Paired analyses of significant differential gene expression (≥2 fc and P<1.12E-06) in BE vs NE and BE vs NC and enrichment in known biological processes.
A. The left Venn diagram represents the total number of genes with significant differential expression between BE and NE (≥2 fc and P<1.12E-06), whereas the right Venn diagram represents the total number with genes significant differential expression between BE and NC (≥2 fc and P<1.12E-06). The overlap between the two differentially-expressed sets contained 205 genes used for functional classification and pathway-based analyses. B. Enrichment of the 205 genes in known biological processes (GO, Ariadne Genomics, MD). The columns entitled: ‘Total no of genes in process’ and ‘Number of genes involved in process (% overlap)’ refer to the total number of genes currently known in each process according to the database (Pathway Studio 9.00), and the % overlap of the 205 genes with the total gene number in each process, respectively. Enrichment of the 205 genes identified in each process relative to the whole gene set is also shown. The largest proportion of genes (7.3%) out of the 205 genes were involved in response to drugs and cell adhesion; however, relative to the overall number of genes in the identified process, cellular response to insulin showed the greatest enrichment.

