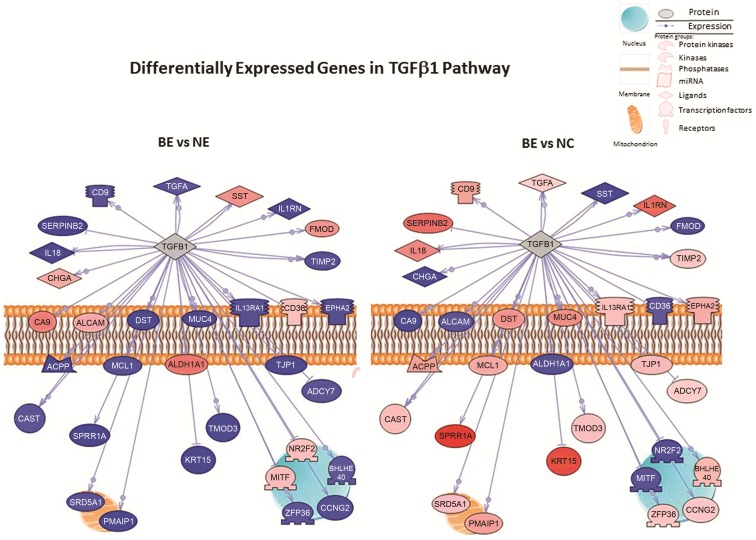
Figure 3. Pathway-based analyses of common differentially expressed genes in BE vs NE and BE vs NC comparisons.
Two hundred and five overlapping genes were identified between BE vs. NE and BE vs. NC tissues after Bonferroni correction (P<1.12-E06) and with a 2-fold or greater differential expression. Diagram illustrates the TGF-β1 signaling pathway in BE vs NE and BE vs NC comparative groups. The direction and/or magnitude of expression is inverse for thirty two genes in the TGF-β1 network between the comparative groups. Genes include: SERPINB2, TMOD3, EPHA2, KRT15, ADCY7, SST, FMOD, CD36, CA9, ALCAM, IL1RN, TIMP2, CAST, MITF, SPRR1A, BHLHE40, MCL1, IL13RA1, ACPP, SRD5A1, NR2F2, ALDH1A1, DST, TJP1, CD9, TGFA, MUC4, PMAIP1, ZFP36, CCNG2, IL18 and CHGA. Data source: Signaling Pathways, Ariadne Pathways. Primary red and blue colors and shading indicate the direction and degree of differential expression with pink to red indicating degrees of increasing upregulation and light blue to darker blue indicating increasing downregulation. Grey indicates a gene product that is part of the pathway, but is absent in the experimental list tested. Abbreviations: BE, Barrett's; NE, normal squamous epithelium; NC, normal gastric cardia epithelium.

