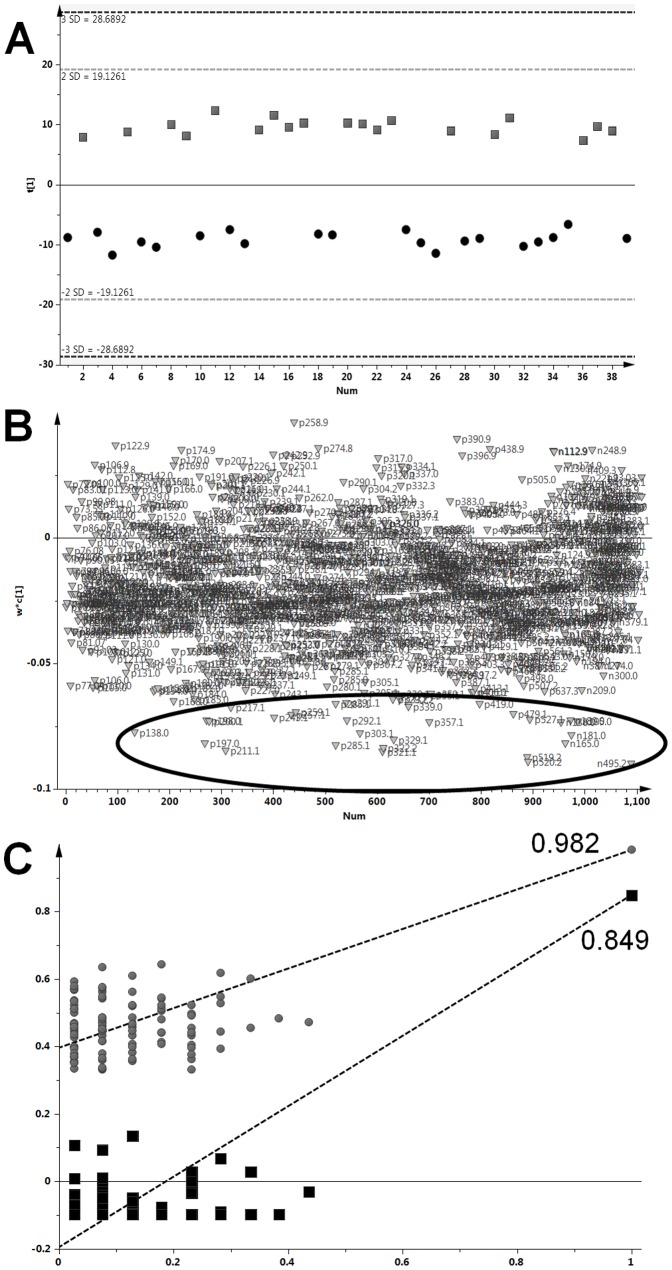
Figure 1. Metabolomic profiling of spot urines from SU.VI.MAX2 subjects.
Subjects reported either low or high consumption of coffee, represented by squares and circles respectively. A) One-dimensional OSC-PLS-DA score plot of urinary metabolomes of low and high consumers. B) Loading plot of the OSC-PLS-DA. Circled outlying ions contribute most strongly to the discrimination. C) Model validation assessed by permutation test (n = 100).

