Figure 5.

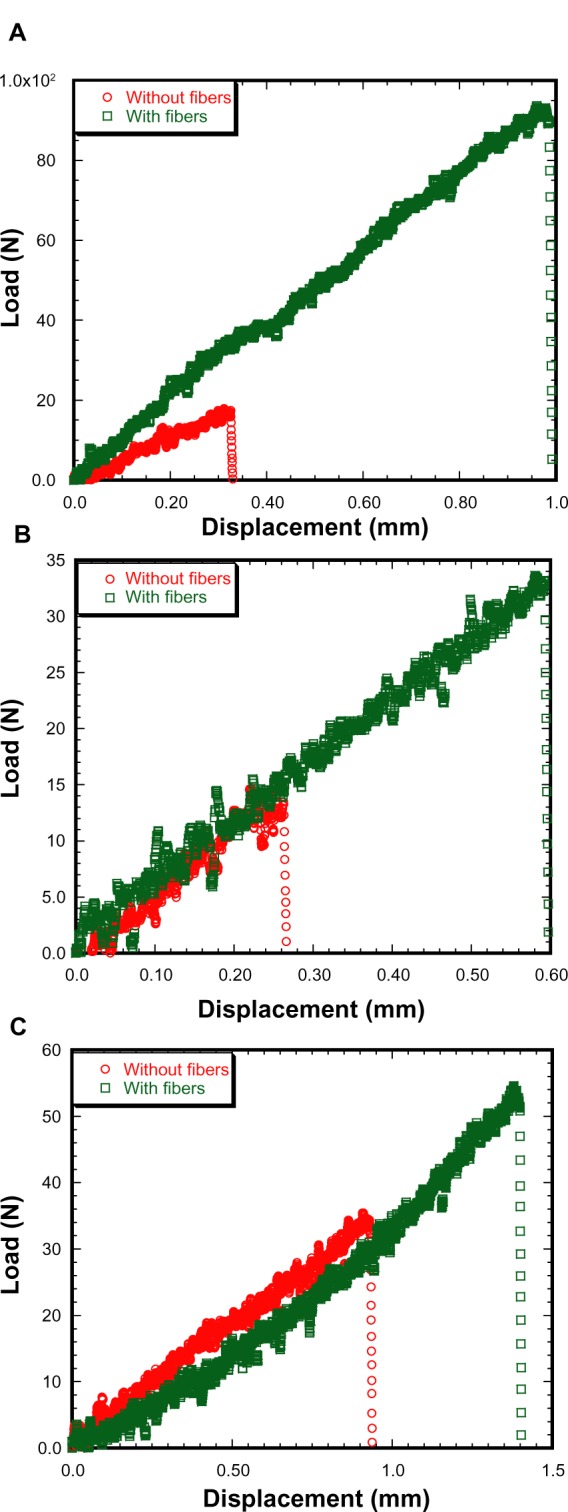
Load versus displacement graphs of titanium–poly(methyl methacrylate) samples under (A) tension, (B) mixed, and (C) shear load.

Load versus displacement graphs of titanium–poly(methyl methacrylate) samples under (A) tension, (B) mixed, and (C) shear load.