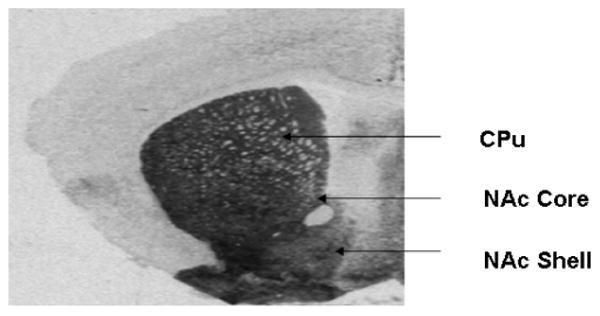
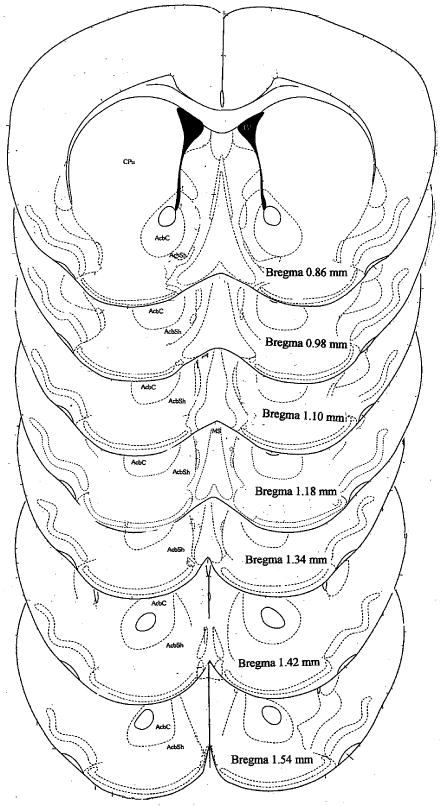
Figure 2.


Quantitative analysis of messenger RNA and receptor densities were performed on autoradiograph films by quantifying grey levels on the exposed film in regions corresponding to the caudate putamen (CPu), nucleus accumbens core (NAc core) and shell (NAc shell). A: This is a representative photomicrograph of an animal used in this study. B: Schematic illustration of brain regions analyzed in the mouse striatum. The coronal sections depicted are adapted from the atlas by Franklin and Paxinos (1997).
