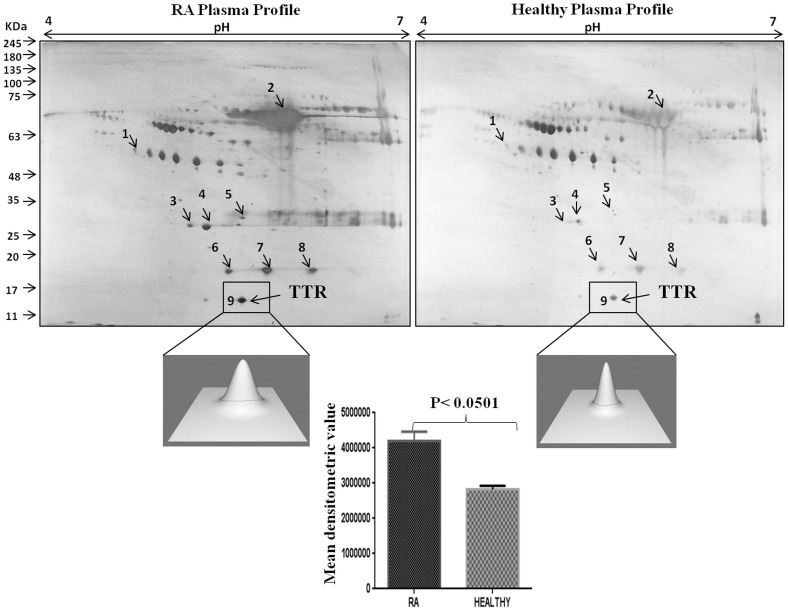
Figure 1. Two dimensional gel electrophoresis of plasma proteins.
A representative silver stained 2-DE gel image of plasma proteins from three sets of samples from RA and controls patients. The gels were analyzed for differential expression of proteins using PD-Quest software. The lower panel showed 3D view of TTR expression and their densitometric analysis demonstrated 1.4 fold elevated expression of TTR in RA as compared to healthy control.

