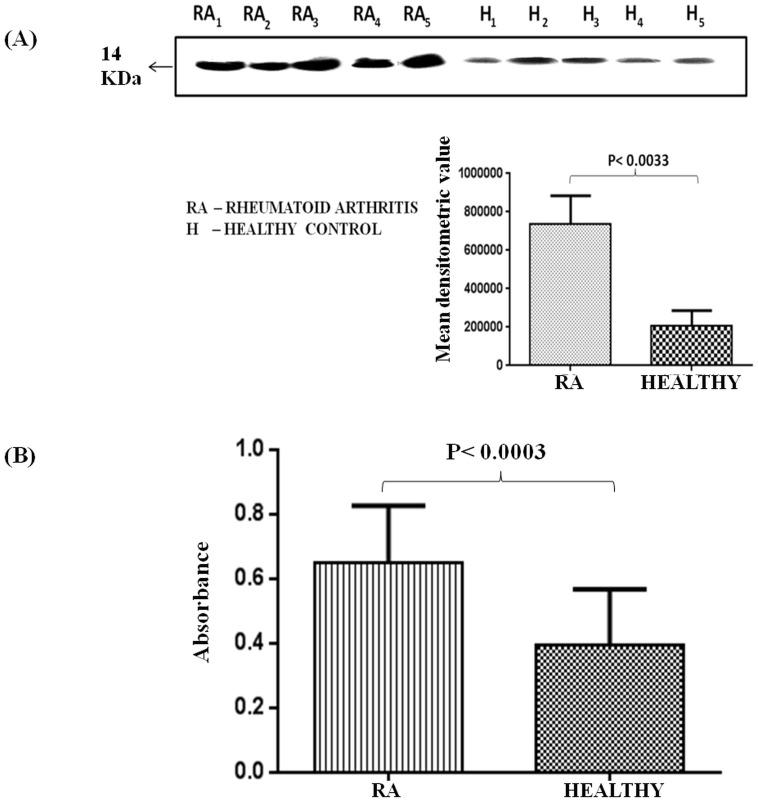
Figure 2. Expression analysis of TTR in the plasma of RA.
(A) Western blot was performed using plasma proteins of RA patients (n = 12) and healthy controls (n = 12). Densitometric analysis of band developed for TTR followed by statistical analysis using paired two tailed t-test showed 3.6 fold elevated expression of TTR in RA as compared to healthy controls. (B) ELISA of TTR in the plasma of RA patients (n = 60) and controls (n = 60) indicated 1.6 fold increased expression of TTR in the plasma of RA.

