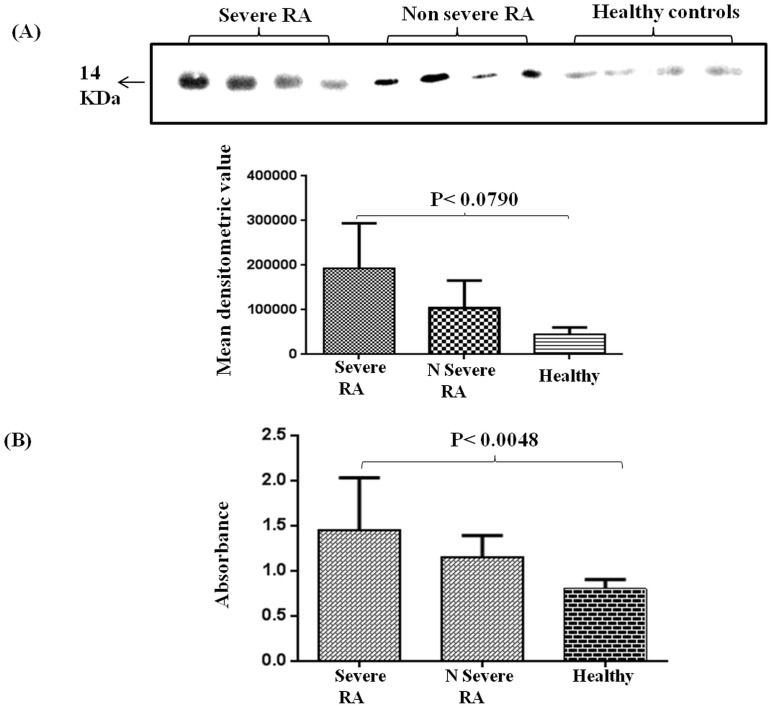
Figure 3. Expression of TTR in plasma of severe and non severe RA and healthy control.
(A) Western blot analysis of plasma obtained from severe (n = 28), non severe (n = 22) and healthy control (n = 25) revealed 4.75 fold and 2.5 fold increased expression of TTR in severe and non severe RA patients respectively as compared to healthy controls. (B) ELISA of TTR in severe and non severe samples was performed and compared with healthy controls. TTR expression was significantly up regulated (p<0.0048) in severe and non severe RA patients as compared to healthy control (2.0 fold and 1.5 fold respectively).

