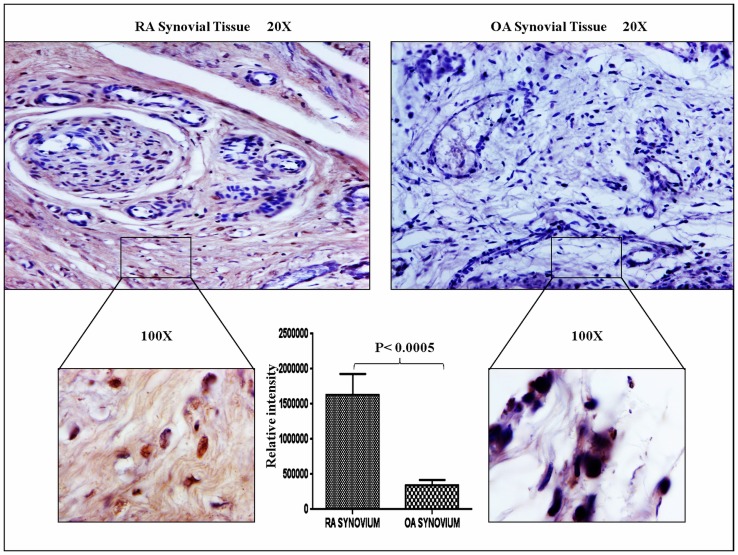
Figure 5. Immunohistochemistry of synovium.
To observe the expression of TTR in synovium (RA, n = 3 and OA, n = 3), IHC were performed. Tissue samples were fixed, processed and stained with DAB. Brown colour indicates the presence of autoantigen in synovium. Upper panel shows the image of synovial tissue at 20X and lower panel shows the image at 100X magnification. TTR expression was predominantly high in RA as compared to OA synovium. Densitometric analysis revealed approximately 5 fold up regulation of TTR expression in RA synovium as compared to OA.

