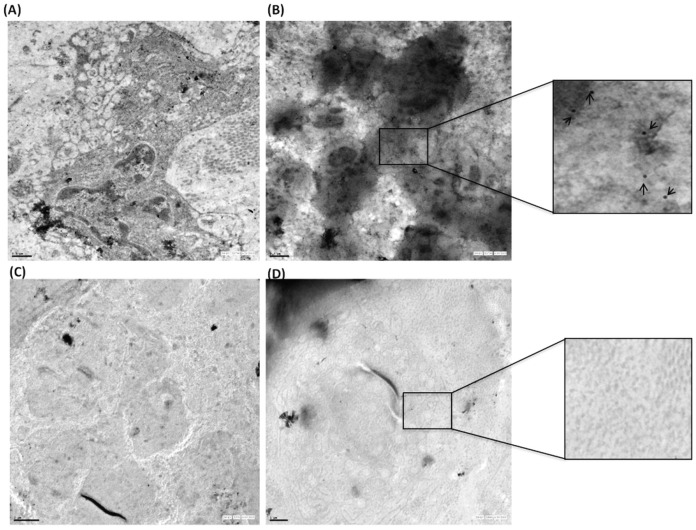
Figure 7. Quantitation of TTR in synovium by immunoelectron microscopy.
RA (n = 3) and OA (n = 3) synovium were surgically removed in aseptic condition, fixed and processed for electron microscopy. Ultrathin sections were labelled with 20 nm gold conjugated secondary antibody. Upper panel (A) shows evenly distributed gold label in RA synovium (B) Selected area has been magnified and marked with arrows to show the gold labelling. Lower panel (C, D) shows the negligible level of TTR expression in OA synovium (Scale bar A, B, D 1 μm, C 2 μm).

