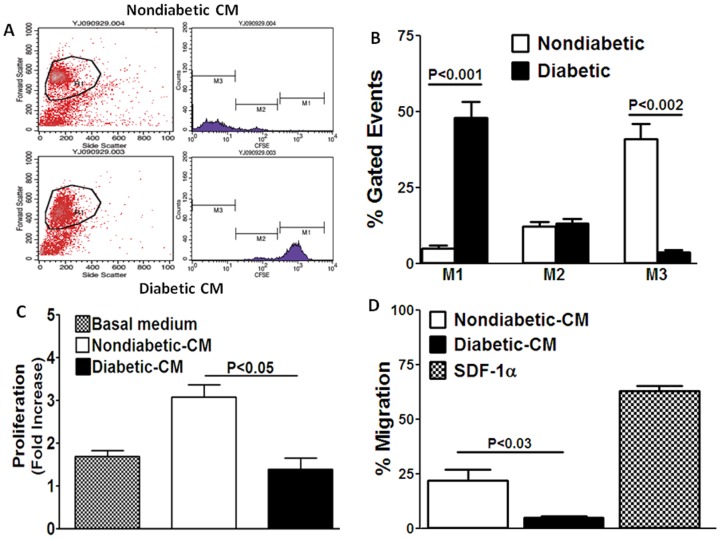
Figure 4. Paracrine proliferative and migratory functions of CM obtained from nondiabetic and diabetic CD34+ cells.
A, Representative dot plots of CFSE-loaded CD34+ cells following 72 hour treatment with nondiabetic- or diabetic-CM. Number of events in the M1 region (high intensity region) represent the number of nonproliferating cells while those in the M3 region (low intensity region) represent proliferating cells. Events in the M2 region represent cells that are proliferating at lower rate. B, Proliferation was greater in cells treated with nondiabetic-CM compared to diabetic-CM (M3 region, **P<0.002), but was significantly lower in cells treated with diabetic-CM (M1 region, **P<0.001). C, BrdU incorporation in CD34+cells was enhanced by nondiabetic-CM by 3.2-fold compared to the basal medium. Diabetic-CM failed to induce BrdU incorporation (P<0.05). D, Nondiabetic-CM enhanced migration of CD34+ cells expressed as percent of untreated cells, which was approximately one third of the response produced by SDF-1α. Migratory response induced by diabetic-CM was significantly lower compared to the response produced by nondiabetic-CM (P<0.03).

