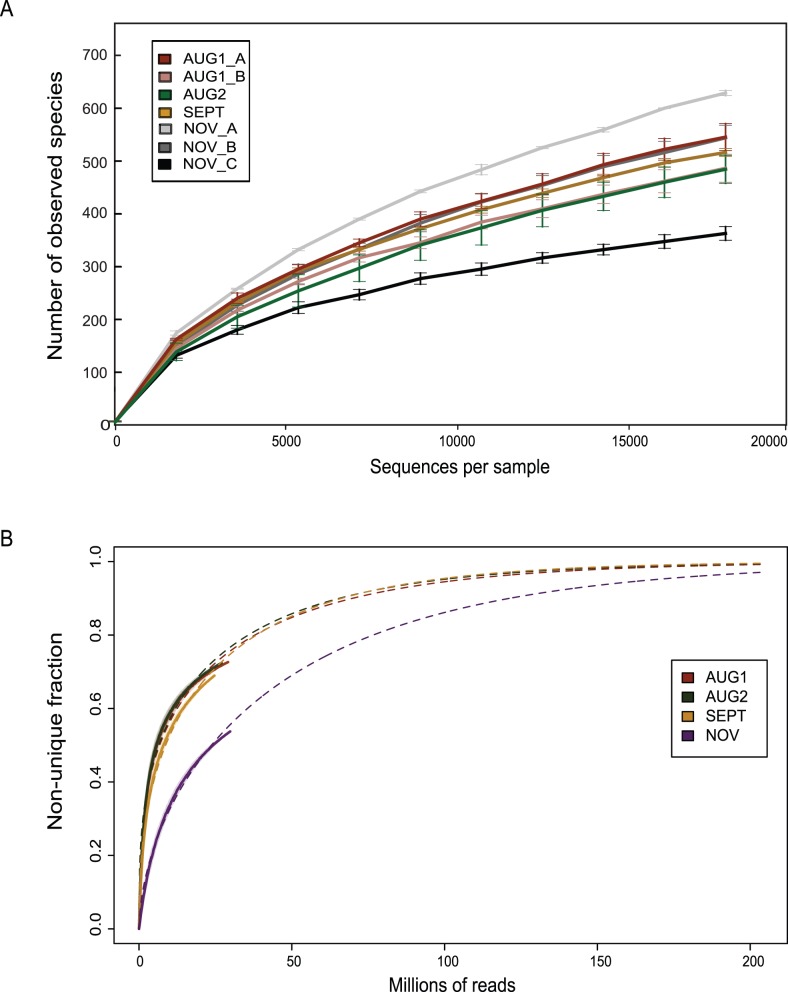
Figure 1. Diversity estimates for the four Lake Lanier timepoints.
. A) Alpha diversity based on observed species (97% OTUs) from 16S amplicons for each of the nine samples. Error bars represent the variation observed among duplicate sequencing runs. B) Redundancy curves of the metagenomes of the four timepoints using (see Methods for details). The curves show that NOV is a more diverse sample, e.g., with the same sequencing effort it results in a lower coverage.

