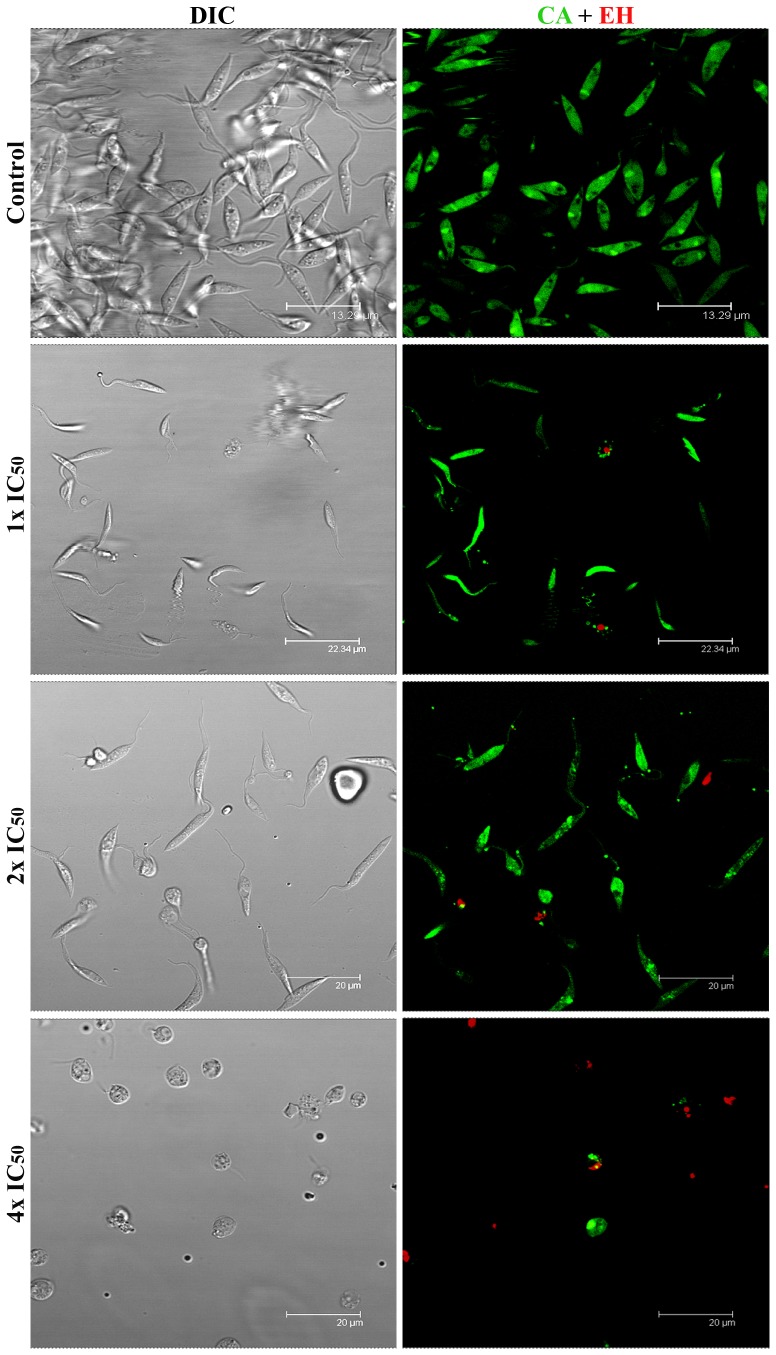
Figure 4. Confocal microscopy of control and MBHA3-treated parasites submitted to CA/EH labelling.
Control cells presenting normal morphology as observed by DIC (left column) and CA bright green fluorescence indicative of intense esterase activity. Few control cells were labeled with EH (red). However, a dose-dependent loss of green fluorescence with corresponding increase in red fluorescence could be observed in the treated cells. Note in the 4x IC50 treated-cells the presence of swollen parasites.

