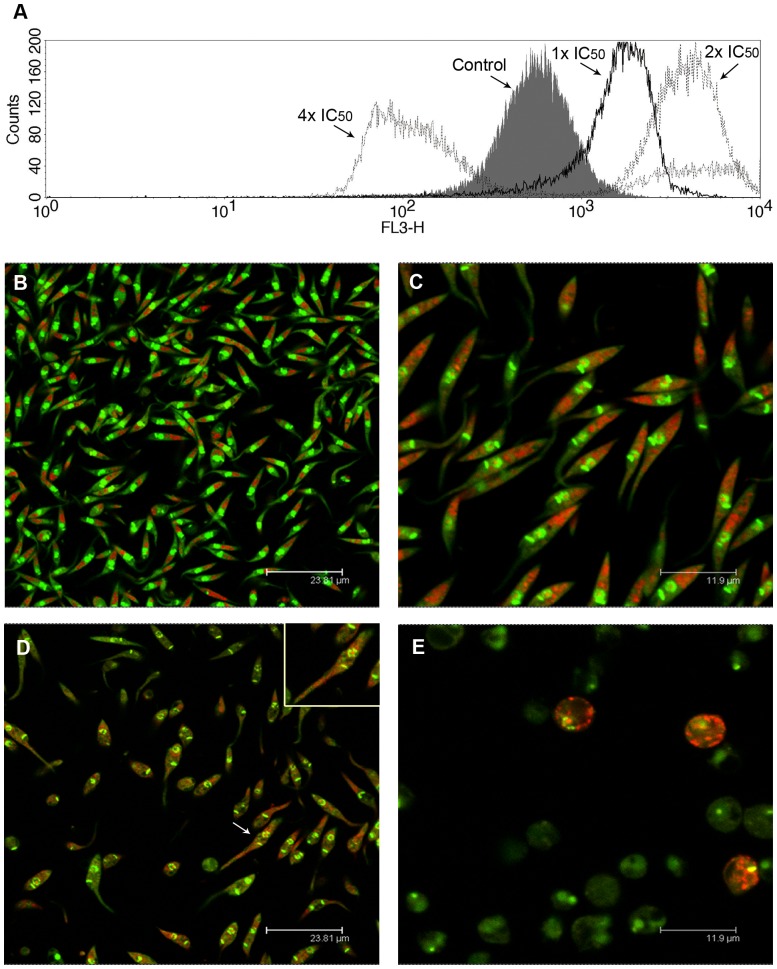
Figure 6. Effects of MBHA3 treatment on the acidic compartments of T. cruzi.
(A) Overlay flow cytometric histograms of the control and treated-cells labeled with AO, after 72 hours of drug incubation. A gradual shift of the red fluorescence could be observed in the cells treated with the IC50 and the 2x IC50 of MBHA3. Nevertheless, in cells treated with the 4x IC50 of MBHA3, a striking decrease of the fluorescent signal from red channel was observed. (B–E). Confocal microscopy images of the control (B) and treated-cells (C–E). Control cells presented a normal morphology with a bright green nucleus, pale green cytoplasm and large red-labeled compartments at the posterior end of cells (B). Detail of the IC50-treated culture showing slight changes in the parasite nucleus. (C). Aspect of parasite culture treated with the 2x IC50 of MBHA3 showing severe acidification of the parasite cytoplasm (D). Note the presence of the pyknotic nucleus (white arrow, inset). Parasites treated with the 4x IC50 of MBHA3 showed a round-shape body and a decrease in both green and red AO fluorescent signals (E).

