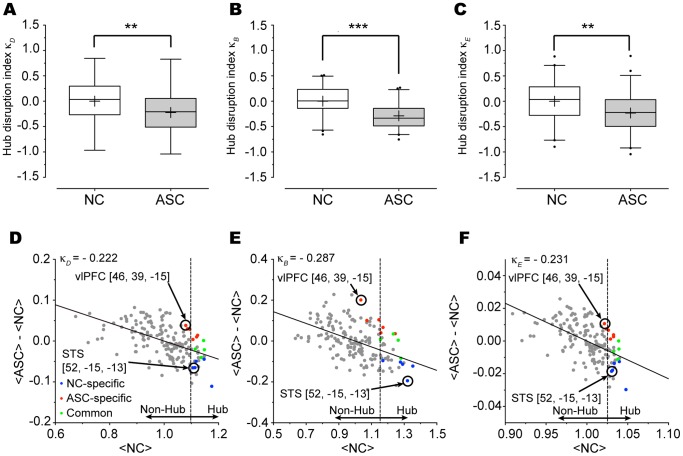
Figure 5. Hub disruption index for each of the three normalized local network metrics of degree; betweenness; and nodal efficiency.
The ASC group (gray) exhibited significant reductions in all the three hub disruption indices (κD: p = 0.007; κB: p<0.001; κE: p = 0.006) (A, B, and C). For illustrative purposes, each of the local metrics was averaged, and then the hub disruption index was calculated at the group level (D, E, and F). Each of hub disruption indices showed significantly negative values in the ASC group, indicating the disruption of hub organization. The colors represent the following groups: NC-specific hub: blue, ASC-specific hub: red, common hub: green. Of note, nodes with high hub scores (≥2.1) were considered as hubs in this study. Significance levels are denoted by **p<0.01 and ***p<0.001, respectively.

