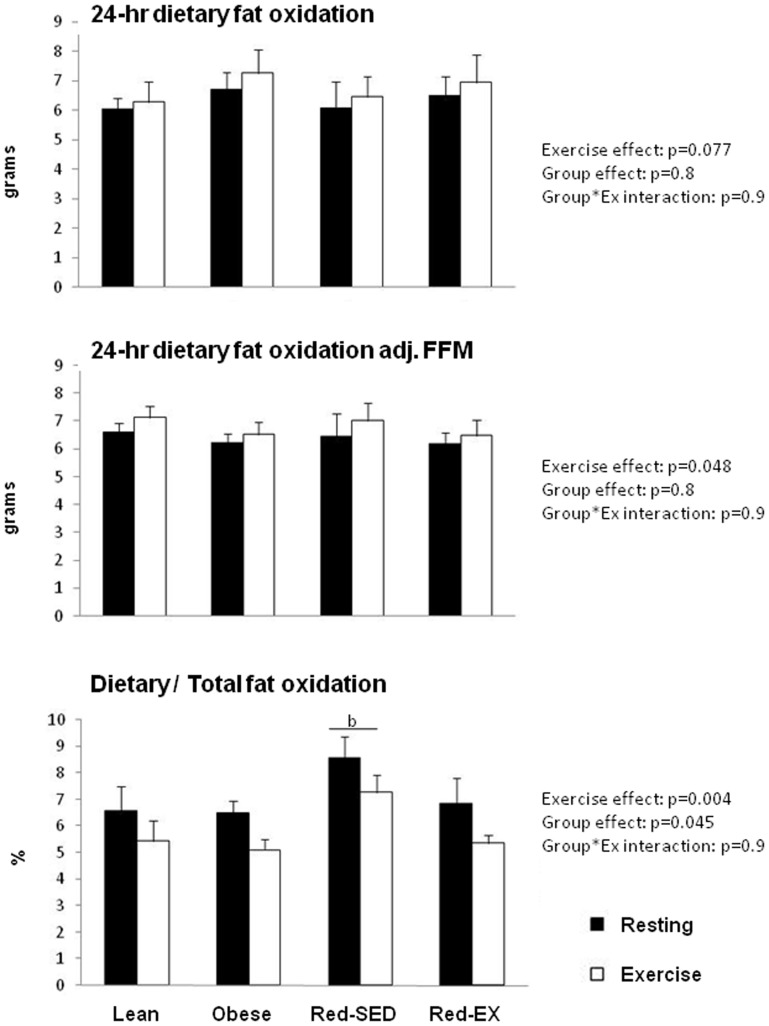
Figure 5. Dietary fat oxidation, i.e. the amount of fat oxidized over 24-hr coming from the breakfast meal only before (top) and after adjustment for fat-free mass (FFM) (middle), and the ratio of total and dietary fat oxidation (bottom) in lean (n = 10), obese (n = 9), sedentary reduced-obese (Red-SED, n = 7) and exercising reduced-obese (Red-Ex, n = 12).
Statistics are presented on the Figure.

