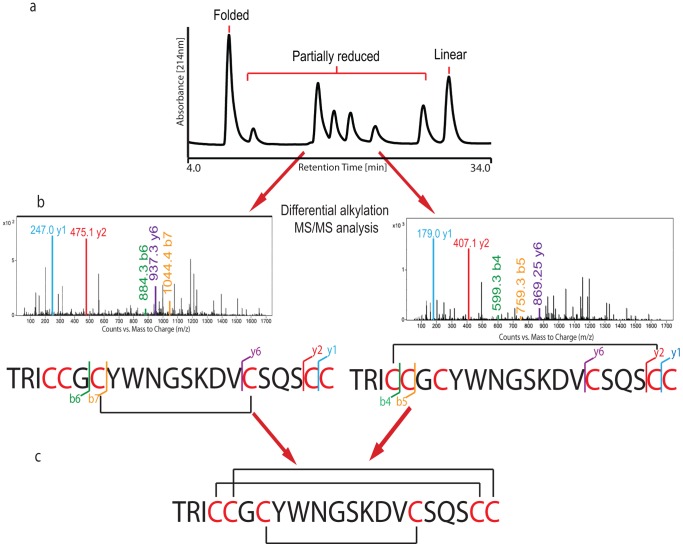
Figure 3. Disulfide mapping of Tv1.
a) RP-HPLC fractionation of all differentially folded peaks (on HPLC gradient of 20% to 35% buffer B (80% Acetonitrile, 0.1% TFA) in buffer A (water, 0.1% TFA) over 75 min. b) MS-MS spectrum of partially reduced peptide peaks showing representative alkylated b and y ions. c) Schematic representation of Tv1 with predicted disulfide bridges.

