Figure 1.
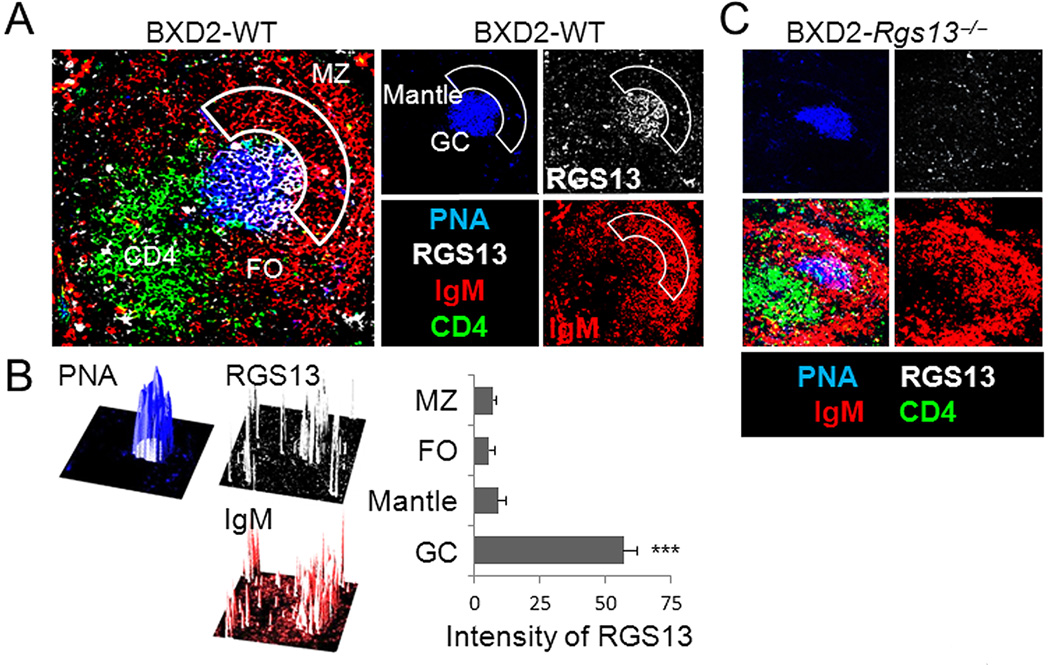
RGS13 is exclusively expressed by GC B cells. Confocal imaging photomicrographs of RGS13 expression (white) in the spleen of 3-mo-old (A, B) BXD2 or (C) control BXD2-Rgs13−/− mice. A, C, Frozen spleen sections were costained with PNA (blue), anti-IgM (red) and anti-CD4 (green)(Objective lens = 20×). Abbreviations used: MZ, marginal zone; FO, follicular area. Image-J analysis of the RGS13 color intensity relative to the color intensity of PNA and IgM by overlay of separate color projections. B, The individual 3D plots represent the section of a representative BXD2 spleen tissue examined by confocal microscopy, with the z-axis representing intensity. Intensity of RGS13 in specified areas is shown as the mean ± SEM. Four sections were evaluated with 3–5 randomly chosen follicles analyzed per section (*** p<0.005 between RGS13 in GC compared to RGS13 in other regions).

