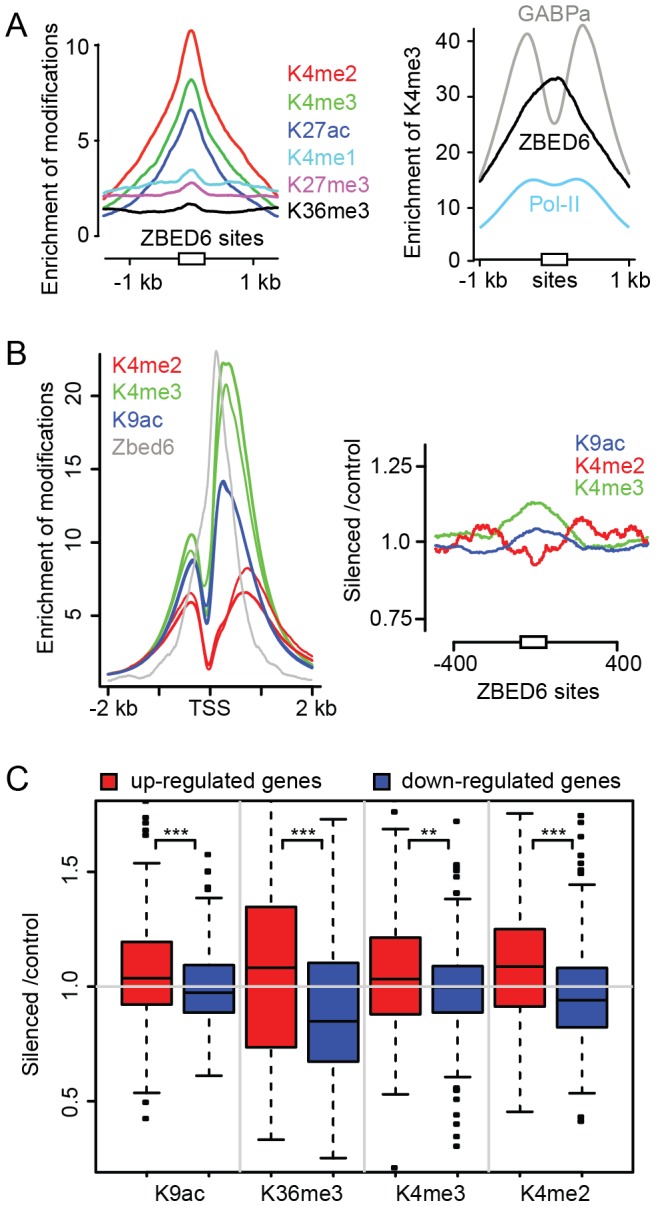
Figure 4. Histone modifications associated with ZBED6 target sites and other sites in C2C12 myoblast cells.

(A) Left panel: ChIP sequencing data from six histone modifications including H3K4me2 (dark red), H3K4me3 (green), H3K27ac (purple), H3K4me1 (dark blue), H3K27me3 (pink), and H3K36me3 (black) located within 1 kb from ZBED6 target sites (white square). Right panel: enrichment of H3K4me3 over GABPa (grey), ZBED6 (dark) and Polymerase II (Pol-II) binding sites (light blue). (B) Left panel: genome-wide enrichment over TSS for active histone marks including H3k4me2 (dark red), H3K4me3 (green), H3K9ac (dark blue) in silenced (narrow lines) and control cells (bold lines). Signals for ZBED6 (dark) are shown for reference. Right panel: ratio of the enrichment between silenced and control (silenced/control) over ZBED6 peak centers for H3K4me2 (dark red), H3K4me3 (green) and H3K9ac (dark blue). (C) The histone modification ratios between silenced and control samples downstream of TSS for up-regulated and down-regulated (blue) genes after Zbed6 silencing normalized to counts for all non-DE genes.
